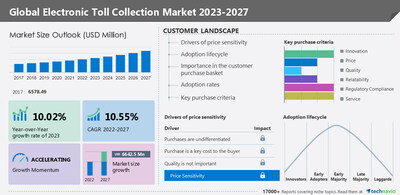
NEW YORK, Jan. 13, 2023 /PRNewswire/ — According to Technavio, the global electronic toll collection market size is estimated to grow by USD 6642.5 million from 2022 to 2027. The market is estimated to grow at a CAGR of 10.55% during the forecast period. APAC will account for 40% of the market’s growth during the forecast period – For more Insights on market size Request a sample report

Global electronic toll collection market – Five forces
The global electronic toll collection market is fragmented, and the five forces analysis covers–
- Bargaining Power of Buyers
- The threat of New Entrants
- Threat of Rivalry
- Bargaining Power of Suppliers
- Threat of Substitutes
- Interpretation of porter’s five models helps to strategize the business, for entire details – buy the report!
The report includes the market’s adoption lifecycle, from the innovator’s stage to the laggard’s stage. It focuses on adoption rates in different regions based on penetration. Furthermore, the report also includes key purchase criteria and drivers of price sensitivity to help companies evaluate and develop their growth strategies.
Segment overview
Technavio has segmented the market based on application (highways and urban), technology (RFID-based, DARC, and others), and geography (APAC, Europe, North America, South America, and the Middle East and Africa).
- The market share growth of the highways segment will be higher than the other segments during the forecast period. Due to a rise in infrastructure development and better traffic management practices at toll booths on highways, the highways segment, which currently holds the biggest market share of the electronic toll collection market, is anticipated to dominate the market during the projected period.
Geography overview
By geography, the global electronic toll collection market is segmented into APAC, Europe, North America, South America, and the Middle East and Africa. The report provides actionable insights and estimates the contribution of all regions to the growth of the global electronic toll collection market.
- APAC will account for 36% of the market’s growth during the forecast period. Rapid digitalization is increasing the demand for electronic toll collection in the region, which is why emerging economies like China, India, Indonesia, and Malaysia are seeing growth in the adoption of electronic toll-collecting systems. Due to the high rate of RFID tag adoption in APAC and the governmental regulations to install RFID tags in cars, the region is expected to grow significantly throughout the projection period.
Key factor driving market growth
- The rising demand for electronic toll collection systems in road tax collection is notably driving the market growth.
- The incorporation of RFID chips inside vehicles is being promoted by nations like India, Indonesia, and Thailand to make it easier to pay tolls. To effectively manage resources and cut unnecessary costs, many nations are expediting the development of electronic toll system infrastructure.
- Toll operations can generate more money by implementing an electronic toll collection system which can then be used to upgrade the road system. Such advancement will contribute to the growth of the market during the forecast period.
Leading trends influencing the market
- The growing popularity of RFID-based license plates is the key trend in the market.
- Traditionally, RFID tags are placed on windscreens so that RFID readers installed at toll booths can look up vehicle identifying numbers and process online toll payments. Electronic license plates are those that have RFID tags included in the license plate. These electronic number plates can be used for access control, traffic management, vehicle identification and anti-counterfeit registration.
- As the sticker self-destructs when removed, it aids in the identification of vehicles with suspected stolen or cloned license plates by the authorities. These developments are expected to impact the focus market growth during the forecast period positively.
Major challenges hindering the market growth
- High capital investment in DSRC and GNSS-based electronic toll collection systems is the major challenge impeding market growth.
- The high installation costs for electronic payment technologies including DSRC, GNSS, and related onboard equipment are one of the biggest obstacles in the global market for electronic tax payments.
- There are significant hidden costs associated with implementing, using, and understanding the functioning of the technology, including maintenance expenses, license fees, and user training costs for information management, monitoring, and deployment. During the projected period, these factors are anticipated to restrain the global market for electronics collections from expanding.
What are the key data covered in this electronic toll collection market report?
- CAGR of the market during the forecast period
- Detailed information on factors that will drive the growth of the electronic toll collection market between 2023 and 2027
- Precise estimation of the size of the electronic toll collection market and its contribution to the parent market
- Accurate predictions about upcoming trends and changes in consumer behavior
- Growth of the electronic toll collection market across APAC, Europe, North America, South America, and Middle East and Africa
- A thorough analysis of the market’s competitive landscape and detailed information about vendors
- Comprehensive analysis of factors that will challenge the growth of electronic toll collection market vendors
Gain instant access to 17,000+ market research reports.
Technavio’s SUBSCRIPTION platform
Related Reports:
Infrared Sensors Market by Application, Technology, and Geography – Forecast and Analysis 2023-2027: The infrared (IR) sensors market is estimated to grow at a CAGR of 8.24% between 2022 and 2027. The size of the market is forecast to increase by USD 224.7 million. The increasing number of burglaries is notably driving the market growth, although factors such as the impact of environmental conditions on infrared sensors may impede the market growth.
Motherboard Market by Form Factor, End-user, and Geography – Forecast and Analysis 2023-2027: The motherboard market is estimated to grow at a CAGR of 17.53% between 2022 and 2027. The size of the market is forecast to increase by USD 10,466.71 million. The rising adoption of smartphones is notably driving the market growth, although factors such as the availability of substitutes may impede the market growth.
|
Electronic Toll Collection Market Scope |
|
|
Report Coverage |
Details |
|
Page number |
156 |
|
Base year |
2022 |
|
Historic period |
2017-2021 |
|
Forecast period |
2023-2027 |
|
Growth momentum & CAGR |
Accelerate at a CAGR of 10.55% |
|
Market growth 2023-2027 |
USD 6642.5 million |
|
Market structure |
Fragmented |
|
YoY growth 2022-2023 (%) |
10.02 |
|
Regional analysis |
APAC, Europe, North America, South America, and Middle East and Africa |
|
Performing market contribution |
APAC at 36% |
|
Key countries |
US, China, India, Germany, and UK |
|
Competitive landscape |
Leading Vendors, Market Positioning of Vendors, Competitive Strategies, and Industry Risks |
|
Key companies profiled |
ABERTIS INFRAESTRUCTURAS SA, Cubic Corp., EFKON GmbH, Electronic Transaction Consultants, LLC, FEIG ELECTRONIC GmbH, G.E.A., International Road Dynamics Inc., Kapsch TrafficCom AG, Mitsubishi Heavy Industries Ltd., Neology Inc., Perceptics Inc., Q Free ASA, Raytheon Technologies Corp., SICE TyS, Siemens AG, Star Systems International Ltd., TECSIDEL S.A, Thales Group, Toshiba Corp., and TransCore |
|
Market dynamics |
Parent Market Analysis; Market growth inducers and obstacles; Fast-growing and slow-growing segment analysis for the forecast period |
|
Customization purview |
If our report has not included the data that you are looking for, you can reach out to our analysts and get segments customized. |
|
Customization purview |
If our report has not included the data that you are looking for, you can reach out to our analysts and get segments customized. |
Browse for Technavio “Information Technology” Research Reports
1 Executive Summary
- 1.1 Market overview
- Exhibit 01: Executive Summary – Chart on Market Overview
- Exhibit 02: Executive Summary – Data Table on Market Overview
- Exhibit 03: Executive Summary – Chart on Global Market Characteristics
- Exhibit 04: Executive Summary – Chart on Market by Geography
- Exhibit 05: Executive Summary – Chart on Market Segmentation by Application
- Exhibit 06: Executive Summary – Chart on Market Segmentation by Technology
- Exhibit 07: Executive Summary – Chart on Incremental Growth
- Exhibit 08: Executive Summary – Data Table on Incremental Growth
- Exhibit 09: Executive Summary – Chart on Vendor Market Positioning
2 Market Landscape
- 2.1 Market ecosystem
- Exhibit 10: Parent market
- Exhibit 11: Market Characteristics
3 Market Sizing
- 3.1 Market definition
- Exhibit 12: Offerings of vendors included in the market definition
- 3.2 Market segment analysis
- Exhibit 13: Market segments
- 3.3 Market size 2022
- 3.4 Market outlook: Forecast for 2022-2027
- Exhibit 14: Chart on Global – Market size and forecast 2022-2027 ($ million)
- Exhibit 15: Data Table on Global – Market size and forecast 2022-2027 ($ million)
- Exhibit 16: Chart on Global Market: Year-over-year growth 2022-2027 (%)
- Exhibit 17: Data Table on Global Market: Year-over-year growth 2022-2027 (%)
4 Historic Market Size
- 4.1 Global electronic toll collection market 2017 – 2021
- Exhibit 18: Historic Market Size – Data Table on Global electronic toll collection market 2017 – 2021 ($ million)
- 4.2 Application Segment Analysis 2017 – 2021
- Exhibit 19: Historic Market Size – Application Segment 2017 – 2021 ($ million)
- 4.3 Technology Segment Analysis 2017 – 2021
- Exhibit 20: Historic Market Size – Technology Segment 2017 – 2021 ($ million)
- 4.4 Geography Segment Analysis 2017 – 2021
- Exhibit 21: Historic Market Size – Geography Segment 2017 – 2021 ($ million)
- 4.5 Country Segment Analysis 2017 – 2021
- Exhibit 22: Historic Market Size – Country Segment 2017 – 2021 ($ million)
5 Five Forces Analysis
- 5.1 Five forces summary
- Exhibit 23: Five forces analysis – Comparison between 2022 and 2027
- 5.2 Bargaining power of buyers
- Exhibit 24: Chart on Bargaining power of buyers – Impact of key factors 2022 and 2027
- 5.3 Bargaining power of suppliers
- Exhibit 25: Bargaining power of suppliers – Impact of key factors in 2022 and 2027
- 5.4 Threat of new entrants
- Exhibit 26: Threat of new entrants – Impact of key factors in 2022 and 2027
- 5.5 Threat of substitutes
- Exhibit 27: Threat of substitutes – Impact of key factors in 2022 and 2027
- 5.6 Threat of rivalry
- Exhibit 28: Threat of rivalry – Impact of key factors in 2022 and 2027
- 5.7 Market condition
- Exhibit 29: Chart on Market condition – Five forces 2022 and 2027
6 Market Segmentation by Application
- 6.1 Market segments
- Exhibit 30: Chart on Application – Market share 2022-2027 (%)
- Exhibit 31: Data Table on Application – Market share 2022-2027 (%)
- 6.2 Comparison by Application
- Exhibit 32: Chart on Comparison by Application
- Exhibit 33: Data Table on Comparison by Application
- 6.3 Highways – Market size and forecast 2022-2027
- Exhibit 34: Chart on Highways – Market size and forecast 2022-2027 ($ million)
- Exhibit 35: Data Table on Highways – Market size and forecast 2022-2027 ($ million)
- Exhibit 36: Chart on Highways – Year-over-year growth 2022-2027 (%)
- Exhibit 37: Data Table on Highways – Year-over-year growth 2022-2027 (%)
- 6.4 Urban – Market size and forecast 2022-2027
- Exhibit 38: Chart on Urban – Market size and forecast 2022-2027 ($ million)
- Exhibit 39: Data Table on Urban – Market size and forecast 2022-2027 ($ million)
- Exhibit 40: Chart on Urban – Year-over-year growth 2022-2027 (%)
- Exhibit 41: Data Table on Urban – Year-over-year growth 2022-2027 (%)
- 6.5 Market opportunity by Application
- Exhibit 42: Market opportunity by Application ($ million)
7 Market Segmentation by Technology
- 7.1 Market segments
- Exhibit 43: Chart on Technology – Market share 2022-2027 (%)
- Exhibit 44: Data Table on Technology – Market share 2022-2027 (%)
- 7.2 Comparison by Technology
- Exhibit 45: Chart on Comparison by Technology
- Exhibit 46: Data Table on Comparison by Technology
- 7.3 RFID-based – Market size and forecast 2022-2027
- Exhibit 47: Chart on RFID-based – Market size and forecast 2022-2027 ($ million)
- Exhibit 48: Data Table on RFID-based – Market size and forecast 2022-2027 ($ million)
- Exhibit 49: Chart on RFID-based – Year-over-year growth 2022-2027 (%)
- Exhibit 50: Data Table on RFID-based – Year-over-year growth 2022-2027 (%)
- 7.4 DARC – Market size and forecast 2022-2027
- Exhibit 51: Chart on DARC – Market size and forecast 2022-2027 ($ million)
- Exhibit 52: Data Table on DARC – Market size and forecast 2022-2027 ($ million)
- Exhibit 53: Chart on DARC – Year-over-year growth 2022-2027 (%)
- Exhibit 54: Data Table on DARC – Year-over-year growth 2022-2027 (%)
- 7.5 Others – Market size and forecast 2022-2027
- Exhibit 55: Chart on Others – Market size and forecast 2022-2027 ($ million)
- Exhibit 56: Data Table on Others – Market size and forecast 2022-2027 ($ million)
- Exhibit 57: Chart on Others – Year-over-year growth 2022-2027 (%)
- Exhibit 58: Data Table on Others – Year-over-year growth 2022-2027 (%)
- 7.6 Market opportunity by Technology
- Exhibit 59: Market opportunity by Technology ($ million)
8 Customer Landscape
- 8.1 Customer landscape overview
- Exhibit 60: Analysis of price sensitivity, lifecycle, customer purchase basket, adoption rates, and purchase criteria
9 Geographic Landscape
- 9.1 Geographic segmentation
- Exhibit 61: Chart on Market share by geography 2022-2027 (%)
- Exhibit 62: Data Table on Market share by geography 2022-2027 (%)
- 9.2 Geographic comparison
- Exhibit 63: Chart on Geographic comparison
- Exhibit 64: Data Table on Geographic comparison
- 9.3 APAC – Market size and forecast 2022-2027
- Exhibit 65: Chart on APAC – Market size and forecast 2022-2027 ($ million)
- Exhibit 66: Data Table on APAC – Market size and forecast 2022-2027 ($ million)
- Exhibit 67: Chart on APAC – Year-over-year growth 2022-2027 (%)
- Exhibit 68: Data Table on APAC – Year-over-year growth 2022-2027 (%)
- 9.4 Europe – Market size and forecast 2022-2027
- Exhibit 69: Chart on Europe – Market size and forecast 2022-2027 ($ million)
- Exhibit 70: Data Table on Europe – Market size and forecast 2022-2027 ($ million)
- Exhibit 71: Chart on Europe – Year-over-year growth 2022-2027 (%)
- Exhibit 72: Data Table on Europe – Year-over-year growth 2022-2027 (%)
- 9.5 North America – Market size and forecast 2022-2027
- Exhibit 73: Chart on North America – Market size and forecast 2022-2027 ($ million)
- Exhibit 74: Data Table on North America – Market size and forecast 2022-2027 ($ million)
- Exhibit 75: Chart on North America – Year-over-year growth 2022-2027 (%)
- Exhibit 76: Data Table on North America – Year-over-year growth 2022-2027 (%)
- 9.6 South America – Market size and forecast 2022-2027
- Exhibit 77: Chart on South America – Market size and forecast 2022-2027 ($ million)
- Exhibit 78: Data Table on South America – Market size and forecast 2022-2027 ($ million)
- Exhibit 79: Chart on South America – Year-over-year growth 2022-2027 (%)
- Exhibit 80: Data Table on South America – Year-over-year growth 2022-2027 (%)
- 9.7 Middle East and Africa – Market size and forecast 2022-2027
- Exhibit 81: Chart on Middle East and Africa – Market size and forecast 2022-2027 ($ million)
- Exhibit 82: Data Table on Middle East and Africa – Market size and forecast 2022-2027 ($ million)
- Exhibit 83: Chart on Middle East and Africa – Year-over-year growth 2022-2027 (%)
- Exhibit 84: Data Table on Middle East and Africa – Year-over-year growth 2022-2027 (%)
- 9.8 China – Market size and forecast 2022-2027
- Exhibit 85: Chart on China – Market size and forecast 2022-2027 ($ million)
- Exhibit 86: Data Table on China – Market size and forecast 2022-2027 ($ million)
- Exhibit 87: Chart on China – Year-over-year growth 2022-2027 (%)
- Exhibit 88: Data Table on China – Year-over-year growth 2022-2027 (%)
- 9.9 US – Market size and forecast 2022-2027
- Exhibit 89: Chart on US – Market size and forecast 2022-2027 ($ million)
- Exhibit 90: Data Table on US – Market size and forecast 2022-2027 ($ million)
- Exhibit 91: Chart on US – Year-over-year growth 2022-2027 (%)
- Exhibit 92: Data Table on US – Year-over-year growth 2022-2027 (%)
- 9.10 India – Market size and forecast 2022-2027
- Exhibit 93: Chart on India – Market size and forecast 2022-2027 ($ million)
- Exhibit 94: Data Table on India – Market size and forecast 2022-2027 ($ million)
- Exhibit 95: Chart on India – Year-over-year growth 2022-2027 (%)
- Exhibit 96: Data Table on India – Year-over-year growth 2022-2027 (%)
- 9.11 Germany – Market size and forecast 2022-2027
- Exhibit 97: Chart on Germany – Market size and forecast 2022-2027 ($ million)
- Exhibit 98: Data Table on Germany – Market size and forecast 2022-2027 ($ million)
- Exhibit 99: Chart on Germany – Year-over-year growth 2022-2027 (%)
- Exhibit 100: Data Table on Germany – Year-over-year growth 2022-2027 (%)
- 9.12 UK – Market size and forecast 2022-2027
- Exhibit 101: Chart on UK – Market size and forecast 2022-2027 ($ million)
- Exhibit 102: Data Table on UK – Market size and forecast 2022-2027 ($ million)
- Exhibit 103: Chart on UK – Year-over-year growth 2022-2027 (%)
- Exhibit 104: Data Table on UK – Year-over-year growth 2022-2027 (%)
- 9.13 Market opportunity by geography
- Exhibit 105: Market opportunity by geography ($ million)
10 Drivers, Challenges, and Trends
- 10.1 Market drivers
- 10.2 Market challenges
- 10.3 Impact of drivers and challenges
- Exhibit 106: Impact of drivers and challenges in 2022 and 2027
- 10.4 Market trends
11 Vendor Landscape
- 11.1 Overview
- 11.2 Vendor landscape
- Exhibit 107: Overview on Criticality of inputs and Factors of differentiation
- 11.3 Landscape disruption
- Exhibit 108: Overview on factors of disruption
- 11.4 Industry risks
- Exhibit 109: Impact of key risks on business
12 Vendor Analysis
- 12.1 Vendors covered
- Exhibit 110: Vendors covered
- 12.2 Market positioning of vendors
- Exhibit 111: Matrix on vendor position and classification
- 12.3 ABERTIS INFRAESTRUCTURAS SA
- Exhibit 112: ABERTIS INFRAESTRUCTURAS SA – Overview
- Exhibit 113: ABERTIS INFRAESTRUCTURAS SA – Product / Service
- Exhibit 114: ABERTIS INFRAESTRUCTURAS SA – Key offerings
- 12.4 Cubic Corp.
- Exhibit 115: Cubic Corp. – Overview
- Exhibit 116: Cubic Corp. – Business segments
- Exhibit 117: Cubic Corp. – Key offerings
- Exhibit 118: Cubic Corp. – Segment focus
- 12.5 EFKON GmbH
- Exhibit 119: EFKON GmbH – Overview
- Exhibit 120: EFKON GmbH – Product / Service
- Exhibit 121: EFKON GmbH – Key offerings
- 12.6 Electronic Transaction Consultants, LLC
- Exhibit 122: Electronic Transaction Consultants, LLC – Overview
- Exhibit 123: Electronic Transaction Consultants, LLC – Product / Service
- Exhibit 124: Electronic Transaction Consultants, LLC – Key offerings
- 12.7 FEIG ELECTRONIC GmbH
- Exhibit 125: FEIG ELECTRONIC GmbH – Overview
- Exhibit 126: FEIG ELECTRONIC GmbH – Product / Service
- Exhibit 127: FEIG ELECTRONIC GmbH – Key offerings
- 12.8 G.E.A.
- Exhibit 128: G.E.A. – Overview
- Exhibit 129: G.E.A. – Product / Service
- Exhibit 130: G.E.A. – Key offerings
- 12.9 International Road Dynamics Inc.
- Exhibit 131: International Road Dynamics Inc. – Overview
- Exhibit 132: International Road Dynamics Inc. – Product / Service
- Exhibit 133: International Road Dynamics Inc. – Key offerings
- 12.10 Kapsch TrafficCom AG
- Exhibit 134: Kapsch TrafficCom AG – Overview
- Exhibit 135: Kapsch TrafficCom AG – Business segments
- Exhibit 136: Kapsch TrafficCom AG – Key news
- Exhibit 137: Kapsch TrafficCom AG – Key offerings
- Exhibit 138: Kapsch TrafficCom AG – Segment focus
- 12.11 Mitsubishi Heavy Industries Ltd.
- Exhibit 139: Mitsubishi Heavy Industries Ltd. – Overview
- Exhibit 140: Mitsubishi Heavy Industries Ltd. – Business segments
- Exhibit 141: Mitsubishi Heavy Industries Ltd. – Key news
- Exhibit 142: Mitsubishi Heavy Industries Ltd. – Key offerings
- Exhibit 143: Mitsubishi Heavy Industries Ltd. – Segment focus
- 12.12 Neology Inc.
- Exhibit 144: Neology Inc. – Overview
- Exhibit 145: Neology Inc. – Product / Service
- Exhibit 146: Neology Inc. – Key offerings
- 12.13 Raytheon Technologies Corp.
- Exhibit 147: Raytheon Technologies Corp. – Overview
- Exhibit 148: Raytheon Technologies Corp. – Business segments
- Exhibit 149: Raytheon Technologies Corp. – Key news
- Exhibit 150: Raytheon Technologies Corp. – Key offerings
- Exhibit 151: Raytheon Technologies Corp. – Segment focus
- 12.14 Siemens AG
- Exhibit 152: Siemens AG – Overview
- Exhibit 153: Siemens AG – Business segments
- Exhibit 154: Siemens AG – Key news
- Exhibit 155: Siemens AG – Key offerings
- Exhibit 156: Siemens AG – Segment focus
- 12.15 Thales Group
- Exhibit 157: Thales Group – Overview
- Exhibit 158: Thales Group – Business segments
- Exhibit 159: Thales Group – Key offerings
- Exhibit 160: Thales Group – Segment focus
- 12.16 Toshiba Corp.
- Exhibit 161: Toshiba Corp. – Overview
- Exhibit 162: Toshiba Corp. – Business segments
- Exhibit 163: Toshiba Corp. – Key offerings
- Exhibit 164: Toshiba Corp. – Segment focus
- 12.17 TransCore
- Exhibit 165: TransCore – Overview
- Exhibit 166: TransCore – Product / Service
- Exhibit 167: TransCore – Key offerings
13 Appendix
- 13.1 Scope of the report
- 13.2 Inclusions and exclusions checklist
- Exhibit 168: Inclusions checklist
- Exhibit 169: Exclusions checklist
- 13.3 Currency conversion rates for US$
- Exhibit 170: Currency conversion rates for US$
- 13.4 Research methodology
- Exhibit 171: Research methodology
- Exhibit 172: Validation techniques employed for market sizing
- Exhibit 173: Information sources
- 13.5 List of abbreviations
- Exhibit 174: List of abbreviations
About Us
Technavio is a leading global technology research and advisory company. Their research and analysis focuses on emerging market trends and provides actionable insights to help businesses identify market opportunities and develop effective strategies to optimize their market positions. With over 500 specialized analysts, Technavio’s report library consists of more than 17,000 reports and counting, covering 800 technologies, spanning across 50 countries. Their client base consists of enterprises of all sizes, including more than 100 Fortune 500 companies. This growing client base relies on Technavio’s comprehensive coverage, extensive research, and actionable market insights to identify opportunities in existing and potential markets and assess their competitive positions within changing market scenarios.
Contact
Technavio Research
Jesse Maida
Media & Marketing Executive
US: +1 844 364 1100
UK: +44 203 893 3200
Email: media@technavio.com
Website: www.technavio.com/
![]()
![]() View original content to download multimedia:https://www.prnewswire.com/news-releases/electronic-toll-collection-market-2023-2027-a-descriptive-analysis-of-five-forces-model-market-dynamics-and-segmentation—technavio-301718925.html
View original content to download multimedia:https://www.prnewswire.com/news-releases/electronic-toll-collection-market-2023-2027-a-descriptive-analysis-of-five-forces-model-market-dynamics-and-segmentation—technavio-301718925.html
SOURCE Technavio
