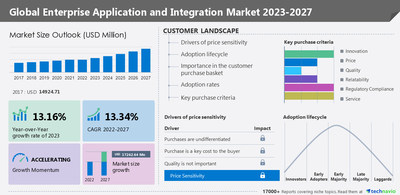
NEW YORK, Nov. 23, 2022 /PRNewswire/ — According to Technavio, the global enterprise application and integration market size is projected to grow by USD 17242.64 million from 2022 to 2027. The market is estimated to grow at a CAGR of 13.34% during the forecast period. North America held the largest share of the global market in 2022, and the market in the region is estimated to witness an incremental growth of 32%.

Discover some insights on market size before buying full report, request a free sample report!
Technavio categorizes the global enterprise application and integration market as a part of the application software market, which covers companies that are engaged in developing and producing application and system software. It also includes companies offering database management software and companies that are engaged in developing and producing software designed for specialized applications for the business or consumer market.
Find insights on parent market & value chain analysis, download an exclusive sample!
The global enterprise application and integration market is fragmented, and the five forces analysis covers –
- Bargaining Power of Buyers
- Threat of New Entrants
- Threat of Rivalry
- Bargaining Power of Suppliers
- Threat of Substitutes
- Interpretation of porter five model helps to strategize the business, for entire details – buy report!
The report includes the market’s adoption lifecycle, from the innovator’s stage to the laggard’s stage. It focuses on adoption rates in different regions based on penetration. Furthermore, the report also includes key purchase criteria and drivers of price sensitivity to help companies evaluate and develop their growth strategies.
Segment Overview
Technavio has segmented the market based on deployment, end-user, and region.
- The on-premise segment will grow at the highest rate during the forecast period. The on-premises model is more secure than cloud solutions. The segment is driven by the increased demand for on-premise solutions among large organizations that are concerned more about functionality than cost-effectiveness. These organizations mainly deal with critical data, so they are increasingly relying on the on-premises model, as it is more secure due to end-to-end quality control and no third-party interference. In addition, on-premise deployments enable the real-time monitoring of business processes and ensure complete security of enterprise data, such as source codes, version enhancements, and source code change histories. Such benefits are driving the growth of the on-premise segment.
Geography Overview
By geography, the global enterprise application and integration market is segmented into North America, Europe, APAC, South America, and the Middle East and Africa. The report provides actionable insights and estimates the contribution of all regions to the growth of the global enterprise application and integration market.
- North America held 32% of the global enterprise application and integration market in 2022. The market in the region is estimated to grow at the fastest pace during the forecast period. The growing demand for cloud computing and increased adoption of CRM solutions among enterprises is driving the demand for enterprise software and applications in the region. In addition, factors such as increasing competition and the need to enhance overall operational efficiency among enterprises are fueling the growth of the enterprise application and integration market in North America.
Key factor driving market growth
- The enhanced efficiency of business processes is one of the key factors driving the growth of the enterprise application and integration market. Enterprise application and integration solutions ensure the collection of data, streamline business processes, and establish effective communication.
- Enterprise application and integration solution links multiple applications within a single shared system to simplify business processes. This reduces the communication gap, which is necessary for making effective business-related decisions.
- Hence, many companies are investing in enterprise application integration as they realize the benefits and need to share information and applications between systems to enhance efficiency. All these factors are driving the growth of the enterprise application and integration market.
Recent trends influencing the market
- The increased adoption of cloud-based integration solutions is the major trend driving the enterprise application and integration market. Cloud-based solutions are gaining popularity among enterprises as they provide faster connectivity features to run multiple applications.
- Cloud-based solutions are also helping enterprises address various challenges such as management, configuration, and governance. This has made processes easier, flexible, and scalable, thereby enhancing the overall agility of business operations.
- Many such benefits are increasing the adoption of cloud-based solutions among enterprises, which is driving the growth of the global enterprise application and integration market.
Major challenges hindering the market growth
- The growing challenges associated with integration will hinder the enterprise application and integration market growth. Some of the reasons causing integration-related issues include the differences in the versions of application software, OS, and hardware configurations. This is because many organizations still use legacy and outdated software systems, applications, programming languages, and backend storage systems.
- The integration of new application software with traditional ICT infrastructure makes it difficult to run all applications smoothly. Interoperability issues disrupt the functioning of operational processes.
- Fixing interoperability issues is time-consuming and increases the cost of IT support services for organizations. Thus, it is imperative for vendors to offer integrated solutions that are integrated with enterprise systems seamlessly. Such challenges are reducing the growth potential in the global enterprise application and integration market.
- CAGR of the market during the forecast period
- Detailed information on factors that will drive the growth of the enterprise application and integration market between 2023 and 2027
- Precise estimation of the size of the enterprise application and integration market size and its contribution of the market in focus to the parent market
- Accurate predictions about upcoming trends and changes in consumer behavior
- Growth of the enterprise application and integration market industry across APAC, North America, Europe, Middle East and Africa, and South America
- Thorough analysis of the market’s competitive landscape and detailed information about vendors
- Comprehensive analysis of factors that will challenge the growth of enterprise application and integration market vendors
Gain instant access to 17,000+ market research reports.
Technavio’s SUBSCRIPTION platform
- The enterprise data warehouse market share is expected to increase by USD 14.56 billion from 2021 to 2026, and the market’s growth momentum will accelerate at a CAGR of 20.42%. The market is segmented by deployment (cloud-based and on-premise) and geography (North America, Europe, APAC, MEA, and South America).
- The enterprise file sync and share market size is predicted to surge by USD 12.84 billion from 2021 to 2026 at a CAGR of 25.22%. The market is segmented by deployment (cloud and on-premises) and geography (North America, Europe, APAC, South America, and Middle East and Africa).
|
Enterprise Application and Integration Market Scope |
|
|
Report Coverage |
Details |
|
Page number |
176 |
|
Base year |
2022 |
|
Historical year |
2017-2021 |
|
Forecast period |
2023-2027 |
|
Growth momentum & CAGR |
Accelerate at a CAGR of 13.34% |
|
Market growth 2023-2027 |
USD 17242.64 million |
|
Market structure |
Fragmented |
|
YoY growth (%) |
13.16 |
|
Regional analysis |
North America, Europe, APAC, South America, and the Middle East and Africa |
|
Performing market contribution |
North America at 32% |
|
Key consumer countries |
US, Canada, China, Japan, India, and Germany |
|
Competitive landscape |
Leading companies, Competitive Strategies, Consumer engagement scope |
|
Key companies profiled |
Adeptia Inc., Atlassian Corp. Plc, Axway Software SA, Boomi LP, Carmatec IT Solutions Pvt. Ltd., Fiorano Technologies Inc., Fujitsu Ltd., Hewlett Packard Enterprise Co., Informatica Inc., International Business Machines Corp., Microsoft Corp., Oracle Corp., Salesforce.com Inc., SAP SE, ScienceSoft USA Corp., SnapLogic Inc., Software AG, Talend Inc., TIBCO Software Inc., and Workato |
|
Market dynamics |
Parent market analysis, Market growth inducers and obstacles, Fast-growing and slow-growing segment analysis, COVID-19 impact and recovery analysis and future consumer dynamics, and market condition analysis for the forecast period. |
|
Customization purview |
If our report has not included the data that you are looking for, you can reach out to our analysts and get segments customized. |
1 Executive Summary
- 1.1 Market overview
- Exhibit 01: Executive Summary – Chart on Market Overview
- Exhibit 02: Executive Summary – Data Table on Market Overview
- Exhibit 03: Executive Summary – Chart on Global Market Characteristics
- Exhibit 04: Executive Summary – Chart on Market by Geography
- Exhibit 05: Executive Summary – Chart on Market Segmentation by Deployment
- Exhibit 06: Executive Summary – Chart on Market Segmentation by End-user
- Exhibit 07: Executive Summary – Chart on Incremental Growth
- Exhibit 08: Executive Summary – Data Table on Incremental Growth
- Exhibit 09: Executive Summary – Chart on Vendor Market Positioning
2 Market Landscape
- 2.1 Market ecosystem
- Exhibit 10: Parent market
- Exhibit 11: Market Characteristics
3 Market Sizing
- 3.1 Market definition
- Exhibit 12: Offerings of vendors included in the market definition
- 3.2 Market segment analysis
- Exhibit 13: Market segments
- 3.3 Market size 2022
- 3.4 Market outlook: Forecast for 2022-2027
- Exhibit 14: Chart on Global – Market size and forecast 2022-2027 ($ million)
- Exhibit 15: Data Table on Global – Market size and forecast 2022-2027 ($ million)
- Exhibit 16: Chart on Global Market: Year-over-year growth 2022-2027 (%)
- Exhibit 17: Data Table on Global Market: Year-over-year growth 2022-2027 (%)
4 Historic Market Size
- 4.1 Global enterprise application and integration market 2017 – 2021
- Exhibit 18: Historic Market Size – Data Table on Global enterprise application and integration market 2017 – 2021 ($ million)
- 4.2 Deployment Segment Analysis 2017 – 2021
- Exhibit 19: Historic Market Size – Deployment Segment 2017 – 2021 ($ million)
- 4.3 End-user Segment Analysis 2017 – 2021
- Exhibit 20: Historic Market Size – End-user Segment 2017 – 2021 ($ million)
- 4.4 Geography Segment Analysis 2017 – 2021
- Exhibit 21: Historic Market Size – Geography Segment 2017 – 2021 ($ million)
- 4.5 Country Segment Analysis 2017 – 2021
- Exhibit 22: Historic Market Size – Country Segment 2017 – 2021 ($ million)
5 Five Forces Analysis
- 5.1 Five forces summary
- Exhibit 23: Five forces analysis – Comparison between2022 and 2027
- 5.2 Bargaining power of buyers
- Exhibit 24: Chart on Bargaining power of buyers – Impact of key factors 2022 and 2027
- 5.3 Bargaining power of suppliers
- Exhibit 25: Bargaining power of suppliers – Impact of key factors in 2022 and 2027
- 5.4 Threat of new entrants
- Exhibit 26: Threat of new entrants – Impact of key factors in 2022 and 2027
- 5.5 Threat of substitutes
- Exhibit 27: Threat of substitutes – Impact of key factors in 2022 and 2027
- 5.6 Threat of rivalry
- Exhibit 28: Threat of rivalry – Impact of key factors in 2022 and 2027
- 5.7 Market condition
- Exhibit 29: Chart on Market condition – Five forces 2022 and 2027
6 Market Segmentation by Deployment
- 6.1 Market segments
- Exhibit 30: Chart on Deployment – Market share 2022-2027 (%)
- Exhibit 31: Data Table on Deployment – Market share 2022-2027 (%)
- 6.2 Comparison by Deployment
- Exhibit 32: Chart on Comparison by Deployment
- Exhibit 33: Data Table on Comparison by Deployment
- 6.3 On-premise – Market size and forecast 2022-2027
- Exhibit 34: Chart on On-premise – Market size and forecast 2022-2027 ($ million)
- Exhibit 35: Data Table on On-premise – Market size and forecast 2022-2027 ($ million)
- Exhibit 36: Chart on On-premise – Year-over-year growth 2022-2027 (%)
- Exhibit 37: Data Table on On-premise – Year-over-year growth 2022-2027 (%)
- 6.4 Cloud – Market size and forecast 2022-2027
- Exhibit 38: Chart on Cloud – Market size and forecast 2022-2027 ($ million)
- Exhibit 39: Data Table on Cloud – Market size and forecast 2022-2027 ($ million)
- Exhibit 40: Chart on Cloud – Year-over-year growth 2022-2027 (%)
- Exhibit 41: Data Table on Cloud – Year-over-year growth 2022-2027 (%)
- 6.5 Market opportunity by Deployment
- Exhibit 42: Market opportunity by Deployment ($ million)
7 Market Segmentation by End-user
- 7.1 Market segments
- Exhibit 43: Chart on End-user – Market share 2022-2027 (%)
- Exhibit 44: Data Table on End-user – Market share 2022-2027 (%)
- 7.2 Comparison by End-user
- Exhibit 45: Chart on Comparison by End-user
- Exhibit 46: Data Table on Comparison by End-user
- 7.3 BFSI – Market size and forecast 2022-2027
- Exhibit 47: Chart on BFSI – Market size and forecast 2022-2027 ($ million)
- Exhibit 48: Data Table on BFSI – Market size and forecast 2022-2027 ($ million)
- Exhibit 49: Chart on BFSI – Year-over-year growth 2022-2027 (%)
- Exhibit 50: Data Table on BFSI – Year-over-year growth 2022-2027 (%)
- 7.4 Government – Market size and forecast 2022-2027
- Exhibit 51: Chart on Government – Market size and forecast 2022-2027 ($ million)
- Exhibit 52: Data Table on Government – Market size and forecast 2022-2027 ($ million)
- Exhibit 53: Chart on Government – Year-over-year growth 2022-2027 (%)
- Exhibit 54: Data Table on Government – Year-over-year growth 2022-2027 (%)
- 7.5 IT and telecom – Market size and forecast 2022-2027
- Exhibit 55: Chart on IT and telecom – Market size and forecast 2022-2027 ($ million)
- Exhibit 56: Data Table on IT and telecom – Market size and forecast 2022-2027 ($ million)
- Exhibit 57: Chart on IT and telecom – Year-over-year growth 2022-2027 (%)
- Exhibit 58: Data Table on IT and telecom – Year-over-year growth 2022-2027 (%)
- 7.6 Healthcare – Market size and forecast 2022-2027
- Exhibit 59: Chart on Healthcare – Market size and forecast 2022-2027 ($ million)
- Exhibit 60: Data Table on Healthcare – Market size and forecast 2022-2027 ($ million)
- Exhibit 61: Chart on Healthcare – Year-over-year growth 2022-2027 (%)
- Exhibit 62: Data Table on Healthcare – Year-over-year growth 2022-2027 (%)
- 7.7 Others – Market size and forecast 2022-2027
- Exhibit 63: Chart on Others – Market size and forecast 2022-2027 ($ million)
- Exhibit 64: Data Table on Others – Market size and forecast 2022-2027 ($ million)
- Exhibit 65: Chart on Others – Year-over-year growth 2022-2027 (%)
- Exhibit 66: Data Table on Others – Year-over-year growth 2022-2027 (%)
- 7.8 Market opportunity by End-user
- Exhibit 67: Market opportunity by End-user ($ million)
8 Customer Landscape
- 8.1 Customer landscape overview
- Exhibit 68: Analysis of price sensitivity, lifecycle, customer purchase basket, adoption rates, and purchase criteria
9 Geographic Landscape
- 9.1 Geographic segmentation
- Exhibit 69: Chart on Market share by geography 2022-2027 (%)
- Exhibit 70: Data Table on Market share by geography 2022-2027 (%)
- 9.2 Geographic comparison
- Exhibit 71: Chart on Geographic comparison
- Exhibit 72: Data Table on Geographic comparison
- 9.3 North America – Market size and forecast 2022-2027
- Exhibit 73: Chart on North America – Market size and forecast 2022-2027 ($ million)
- Exhibit 74: Data Table on North America – Market size and forecast 2022-2027 ($ million)
- Exhibit 75: Chart on North America – Year-over-year growth 2022-2027 (%)
- Exhibit 76: Data Table on North America – Year-over-year growth 2022-2027 (%)
- 9.4 Europe – Market size and forecast 2022-2027
- Exhibit 77: Chart on Europe – Market size and forecast 2022-2027 ($ million)
- Exhibit 78: Data Table on Europe – Market size and forecast 2022-2027 ($ million)
- Exhibit 79: Chart on Europe – Year-over-year growth 2022-2027 (%)
- Exhibit 80: Data Table on Europe – Year-over-year growth 2022-2027 (%)
- 9.5 APAC – Market size and forecast 2022-2027
- Exhibit 81: Chart on APAC – Market size and forecast 2022-2027 ($ million)
- Exhibit 82: Data Table on APAC – Market size and forecast 2022-2027 ($ million)
- Exhibit 83: Chart on APAC – Year-over-year growth 2022-2027 (%)
- Exhibit 84: Data Table on APAC – Year-over-year growth 2022-2027 (%)
- 9.6 South America – Market size and forecast 2022-2027
- Exhibit 85: Chart on South America – Market size and forecast 2022-2027 ($ million)
- Exhibit 86: Data Table on South America – Market size and forecast 2022-2027 ($ million)
- Exhibit 87: Chart on South America – Year-over-year growth 2022-2027 (%)
- Exhibit 88: Data Table on South America – Year-over-year growth 2022-2027 (%)
- 9.7 Middle East and Africa – Market size and forecast 2022-2027
- Exhibit 89: Chart on Middle East and Africa – Market size and forecast 2022-2027 ($ million)
- Exhibit 90: Data Table on Middle East and Africa – Market size and forecast 2022-2027 ($ million)
- Exhibit 91: Chart on Middle East and Africa – Year-over-year growth 2022-2027 (%)
- Exhibit 92: Data Table on Middle East and Africa – Year-over-year growth 2022-2027 (%)
- 9.8 US – Market size and forecast 2022-2027
- Exhibit 93: Chart on US – Market size and forecast 2022-2027 ($ million)
- Exhibit 94: Data Table on US – Market size and forecast 2022-2027 ($ million)
- Exhibit 95: Chart on US – Year-over-year growth 2022-2027 (%)
- Exhibit 96: Data Table on US – Year-over-year growth 2022-2027 (%)
- 9.9 Canada – Market size and forecast 2022-2027
- Exhibit 97: Chart on Canada – Market size and forecast 2022-2027 ($ million)
- Exhibit 98: Data Table on Canada – Market size and forecast 2022-2027 ($ million)
- Exhibit 99: Chart on Canada – Year-over-year growth 2022-2027 (%)
- Exhibit 100: Data Table on Canada – Year-over-year growth 2022-2027 (%)
- 9.10 Germany – Market size and forecast 2022-2027
- Exhibit 101: Chart on Germany – Market size and forecast 2022-2027 ($ million)
- Exhibit 102: Data Table on Germany – Market size and forecast 2022-2027 ($ million)
- Exhibit 103: Chart on Germany – Year-over-year growth 2022-2027 (%)
- Exhibit 104: Data Table on Germany – Year-over-year growth 2022-2027 (%)
- 9.11 China – Market size and forecast 2022-2027
- Exhibit 105: Chart on China – Market size and forecast 2022-2027 ($ million)
- Exhibit 106: Data Table on China – Market size and forecast 2022-2027 ($ million)
- Exhibit 107: Chart on China – Year-over-year growth 2022-2027 (%)
- Exhibit 108: Data Table on China – Year-over-year growth 2022-2027 (%)
- 9.12 Japan – Market size and forecast 2022-2027
- Exhibit 109: Chart on Japan – Market size and forecast 2022-2027 ($ million)
- Exhibit 110: Data Table on Japan – Market size and forecast 2022-2027 ($ million)
- Exhibit 111: Chart on Japan – Year-over-year growth 2022-2027 (%)
- Exhibit 112: Data Table on Japan – Year-over-year growth 2022-2027 (%)
- 9.13 India – Market size and forecast 2022-2027
- Exhibit 113: Chart on India – Market size and forecast 2022-2027 ($ million)
- Exhibit 114: Data Table on India – Market size and forecast 2022-2027 ($ million)
- Exhibit 115: Chart on India – Year-over-year growth 2022-2027 (%)
- Exhibit 116: Data Table on India – Year-over-year growth 2022-2027 (%)
- 9.14 Market opportunity by geography
- Exhibit 117: Market opportunity by geography ($ million)
10 Drivers, Challenges, and Trends
- 10.1 Market drivers
- 10.2 Market challenges
- 10.3 Impact of drivers and challenges
- Exhibit 118: Impact of drivers and challenges in 2022 and 2027
- 10.4 Market trends
11 Vendor Landscape
- 11.1 Overview
- 11.2 Vendor landscape
- Exhibit 119: Overview on Criticality of inputs and Factors of differentiation
- 11.3 Landscape disruption
- Exhibit 120: Overview on factors of disruption
- 11.4 Industry risks
- Exhibit 121: Impact of key risks on business
12 Vendor Analysis
- 12.1 Vendors covered
- Exhibit 122: Vendors covered
- 12.2 Market positioning of vendors
- Exhibit 123: Matrix on vendor position and classification
- 12.3 Adeptia Inc.
- Exhibit 124: Adeptia Inc. – Overview
- Exhibit 125: Adeptia Inc. – Product / Service
- Exhibit 126: Adeptia Inc. – Key offerings
- 12.4 Atlassian Corp. Plc
- Exhibit 127: Atlassian Corp. Plc – Overview
- Exhibit 128: Atlassian Corp. Plc – Product / Service
- Exhibit 129: Atlassian Corp. Plc – Key offerings
- 12.5 Axway Software SA
- Exhibit 130: Axway Software SA – Overview
- Exhibit 131: Axway Software SA – Business segments
- Exhibit 132: Axway Software SA – Key offerings
- Exhibit 133: Axway Software SA – Segment focus
- 12.6 Fiorano Technologies Inc.
- Exhibit 134: Fiorano Technologies Inc. – Overview
- Exhibit 135: Fiorano Technologies Inc. – Product / Service
- Exhibit 136: Fiorano Technologies Inc. – Key offerings
- 12.7 Fujitsu Ltd.
- Exhibit 137: Fujitsu Ltd. – Overview
- Exhibit 138: Fujitsu Ltd. – Business segments
- Exhibit 139: Fujitsu Ltd. – Key offerings
- Exhibit 140: Fujitsu Ltd. – Segment focus
- 12.8 Hewlett Packard Enterprise Co.
- Exhibit 141: Hewlett Packard Enterprise Co. – Overview
- Exhibit 142: Hewlett Packard Enterprise Co. – Business segments
- Exhibit 143: Hewlett Packard Enterprise Co. – Key news
- Exhibit 144: Hewlett Packard Enterprise Co. – Key offerings
- Exhibit 145: Hewlett Packard Enterprise Co. – Segment focus
- 12.9 International Business Machines Corp.
- Exhibit 146: International Business Machines Corp. – Overview
- Exhibit 147: International Business Machines Corp. – Business segments
- Exhibit 148: International Business Machines Corp. – Key offerings
- Exhibit 149: International Business Machines Corp. – Segment focus
- 12.10 Microsoft Corp.
- Exhibit 150: Microsoft Corp. – Overview
- Exhibit 151: Microsoft Corp. – Business segments
- Exhibit 152: Microsoft Corp. – Key news
- Exhibit 153: Microsoft Corp. – Key offerings
- Exhibit 154: Microsoft Corp. – Segment focus
- 12.11 Oracle Corp.
- Exhibit 155: Oracle Corp. – Overview
- Exhibit 156: Oracle Corp. – Business segments
- Exhibit 157: Oracle Corp. – Key news
- Exhibit 158: Oracle Corp. – Key offerings
- Exhibit 159: Oracle Corp. – Segment focus
- 12.12 Salesforce.com Inc.
- Exhibit 160: Salesforce.com Inc. – Overview
- Exhibit 161: Salesforce.com Inc. – Product / Service
- Exhibit 162: Salesforce.com Inc. – Key news
- Exhibit 163: Salesforce.com Inc. – Key offerings
- 12.13 SAP SE
- Exhibit 164: SAP SE – Overview
- Exhibit 165: SAP SE – Business segments
- Exhibit 166: SAP SE – Key news
- Exhibit 167: SAP SE – Key offerings
- Exhibit 168: SAP SE – Segment focus
- 12.14 Software AG
- Exhibit 169: Software AG – Overview
- Exhibit 170: Software AG – Business segments
- Exhibit 171: Software AG – Key offerings
- Exhibit 172: Software AG – Segment focus
- 12.15 Talend Inc.
- Exhibit 173: Talend Inc. – Overview
- Exhibit 174: Talend Inc. – Product / Service
- Exhibit 175: Talend Inc. – Key offerings
- 12.16 TIBCO Software Inc.
- Exhibit 176: TIBCO Software Inc. – Overview
- Exhibit 177: TIBCO Software Inc. – Product / Service
- Exhibit 178: TIBCO Software Inc. – Key offerings
- 12.17 Workato
- Exhibit 179: Workato – Overview
- Exhibit 180: Workato – Product / Service
- Exhibit 181: Workato – Key offerings
13 Appendix
- 13.1 Scope of the report
- 13.2 Inclusions and exclusions checklist
- Exhibit 182: Inclusions checklist
- Exhibit 183: Exclusions checklist
- 13.3 Currency conversion rates for US$
- Exhibit 184: Currency conversion rates for US$
- 13.4 Research methodology
- Exhibit 185: Research methodology
- Exhibit 186: Validation techniques employed for market sizing
- Exhibit 187: Information sources
- 13.5 List of abbreviations
- Exhibit 188: List of abbreviations
About Us
Technavio is a leading global technology research and advisory company. Their research and analysis focus on emerging market trends and provide actionable insights to help businesses identify market opportunities and develop effective strategies to optimize their market positions. With over 500 specialized analysts, Technavio’s report library consists of more than 17,000 reports and counting, covering 800 technologies, spanning 50 countries. Their client base consists of enterprises of all sizes, including more than 100 Fortune 500 companies. This growing client base relies on Technavio’s comprehensive coverage, extensive research, and actionable market insights to identify opportunities in existing and potential markets and assess their competitive positions within changing market scenarios.
Contact
Technavio Research
Jesse Maida
Media & Marketing Executive
US: +1 844 364 1100
UK: +44 203 893 3200
Email: media@technavio.com
Website: www.technavio.com/
![]()
![]() View original content to download multimedia:https://www.prnewswire.com/news-releases/enterprise-application-and-integration-market-2023-2027-a-descriptive-analysis-of-parent-market-five-forces-model-market-dynamics–segmentation—technavio-301685937.html
View original content to download multimedia:https://www.prnewswire.com/news-releases/enterprise-application-and-integration-market-2023-2027-a-descriptive-analysis-of-parent-market-five-forces-model-market-dynamics–segmentation—technavio-301685937.html
SOURCE Technavio
