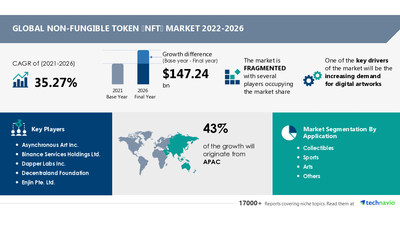
NEW YORK, Aug. 25, 2022 /PRNewswire/ — The NFT MARKET value is set to grow by USD 147.24 billion, progressing at a CAGR of 35.27% from 2021 to 2026, as per the latest report by Technavio. The increasing demand for digital artworks is notably driving the non-fungible token (NFT) market growth, although factors such as uncertainty of the NFT market may impede market growth.
 Market by Application and Geography - Forecast and Analysis 2022-2026")
Globally, NFT has gained traction in digital art applications through the Internet, social media, and other digital mediums. Digital artists can sell one or more limited edition NFT offerings by issuing tokens and artists can also create new forms of an NFT. Therefore, such factors are driving the demand for the global NFT market.
The valuation of NFTs depends considerably on scarcity, uniqueness, and the perception of owners and buyers alongside the availability of distribution channels. Therefore, for a new seller, it is extremely difficult to anticipate the identity of the next buyers of an NFT or the possible factors which can drive their purchase. This uncertainty of the NFT market may impede the market growth.
Browse Summary of the NFT MARKET Research Report to Learn More
- Application
- Collectibles
- Sports
- Arts
- Others
The non-fungible token (NFT) market share growth by the collectibles segment will be significant during the forecast period. Collectibles accounted for the highest market share in 2021. The growth of the collectible segment is majorly driven by the growing demand for digital assets across the world.
- Geography
- APAC
- South America
- Middle East and Africa
- North America
- Europe
43% of the market’s growth will originate from APAC during the forecast period. Singapore, China, and The Philippines are the key markets for non-fungible tokens (NFT) in APAC. However, market growth in this region will be slower than the growth of the market in other regions.
Download NFT MARKET Sample Report to Gain Further Insights
NFT Market 2022-2026: Vendor Analysis and Scope
- Asynchronous Art Inc.
- Binance Services Holdings Ltd.
- Dapper Labs Inc.
- Decentraland Foundation
- Enjin Pte. Ltd.
- Foundation Labs Inc.
- FTX Trading Ltd.
- Funko Inc.
- Gala Games
- Gemini Trust Co. LLC
- Mintable.app
- Mobox Digital Co. Ltd.
- Onchain Labs Inc.
- OpenSea
- Rarible Inc.
- Sorare SAS
- SuperRare Labs Inc.
- Theta Labs Inc.
- Yellowheart LLC
- Yuga Labs LLC
The non-fungible token (NFT) market is fragmented and the vendors are deploying growth strategies such as mergers and acquisitions to compete in the market. To make the most of the opportunities and recover from post COVID-19 impact, market vendors are focusing more on the growth prospects in the fast-growing segments, while maintaining their positions in the slow-growing segments.
- CAGR of the market during the forecast period 2022-2026
- Detailed information on factors that will assist NFT market growth during the next five years
- Estimation of the NFT market size and its contribution to the parent market
- Predictions on upcoming trends and changes in consumer behavior
- The growth of the NFT market
- Analysis of the market’s competitive landscape and detailed information on vendors
- Comprehensive details of factors that will challenge the growth of NFT market vendors
Browse Summary of the TOKENIZATION MARKET Report by Deployment and Geography – Forecast and Analysis 2022-2026: The market value is set to grow by USD 3.60 billion, progressing at a CAGR of 22.49% from 2021 to 2026, as per the latest report by Technavio. The rising number of online transactions is notably driving the tokenization market growth, although factors such as system integration and interoperability issues may impede market growth.
Browse Summary of the ADVANCED AUTHENTICATION MARKET Report by Technology and Geography – Forecast and Analysis 2021-2025: The market value is set to grow by USD 33.65 billion, progressing at a CAGR of 14.52% from 2020 to 2025, as per the latest report by Technavio. The introduction of out-of-band (OOB) authentication is one of the key advanced authentication market trends.
|
NFT Market Scope |
|
|
Report Coverage |
Details |
|
Page number |
120 |
|
Base year |
2021 |
|
Forecast period |
2022-2026 |
|
Growth momentum & CAGR |
Accelerate at a CAGR of 35.27% |
|
Market growth 2022-2026 |
$ 147.24 billion |
|
Market structure |
Fragmented |
|
YoY growth (%) |
30.72 |
|
Regional analysis |
APAC, South America, Middle East and Africa, North America, and Europe |
|
Performing market contribution |
APAC at 43% |
|
Key consumer countries |
United Arab Emirates, Singapore, China, The Philippines, and Venezuela |
|
Competitive landscape |
Leading companies, competitive strategies, consumer engagement scope |
|
Companies profiled |
Asynchronous Art Inc., Binance Services Holdings Ltd., Dapper Labs Inc., Decentraland Foundation, Enjin Pte. Ltd., Foundation Labs Inc., FTX Trading Ltd., Funko Inc., Gala Games, Gemini Trust Co. LLC, Mintable.app, Mobox Digital Co. Ltd., Onchain Labs Inc., OpenSea, Rarible Inc., Sorare SAS, SuperRare Labs Inc., Theta Labs Inc., Yellowheart LLC, and Yuga Labs LLC |
|
Market Dynamics |
Parent market analysis, Market growth inducers and obstacles, Fast-growing and slow-growing segment analysis, COVID 19 impact and future consumer dynamics, and market condition analysis for the forecast period. |
|
Customization preview |
If our report has not included the data that you are looking for, you can reach out to our analysts and get segments customized. |
Browse for Technavio “INFORMATION TECHNOLOGY MARKET” Research Reports
1. Executive Summary
1.1 Market Overview
Exhibit 01: Executive Summary – Chart on Market Overview
Exhibit 02: Executive Summary – Data Table on Market Overview
Exhibit 03: Executive Summary – Chart on Global Market Characteristics
Exhibit 04: Executive Summary – Chart on Market by Geography
Exhibit 05: Executive Summary – Chart on Market Segmentation by Application
Exhibit 06: Executive Summary – Chart on Incremental Growth
Exhibit 07: Executive Summary – Data Table on Incremental Growth
Exhibit 08: Executive Summary – Chart on Vendor Market Positioning
2. Market Landscape
2.1 Market ecosystem
Exhibit 09: Parent market
Exhibit 10: Market characteristics
3. Market Sizing
3.1 Market definition
Exhibit 11: Offerings of vendors included in the market definition
3.2 Market segment analysis
Exhibit 12: Market segments
3.3 Market size 2021
3.4 Market outlook: Forecast for 2021 – 2026
Exhibit 13: Chart on Global – Market size and forecast 2021-2026 ($ billion)
Exhibit 14: Data Table on Global – Market size and forecast 2021-2026 ($ billion)
Exhibit 15: Chart on Global Market: Year-over-year growth 2021-2026 (%)
Exhibit 16: Data Table on Global Market: Year-over-year growth 2021-2026 (%)
4. Five Forces Analysis
4.1 Five Forces Summary
Exhibit 17: Five forces analysis – Comparison between 2021 and 2026
4.2 Bargaining power of buyers
Exhibit 18: Bargaining power of buyers – Impact of key factors in 2021 and 2026
4.3 Bargaining power of suppliers
Exhibit 19: Bargaining power of suppliers – Impact of key factors in 2021 and 2026
4.4 Threat of new entrants
Exhibit 20: Threat of new entrants – Impact of key factors in 2021 and 2026
4.5 Threat of substitutes
Exhibit 21: Threat of substitutes – Impact of key factors in 2021 and 2026
4.6 Threat of rivalry
Exhibit 22: Threat of rivalry – Impact of key factors in 2021 and 2026
4.7 Market condition
Exhibit 23: Chart on Market condition – Five forces 2021 and 2026
5 Market Segmentation by Application
5.1 Market segments
Exhibit 24: Chart on Application – Market share 2021-2026 (%)
Exhibit 25: Data Table on Application – Market share 2021-2026 (%)
5.2 Comparison by Application
Exhibit 26: Chart on Comparison by Application
Exhibit 27: Data Table on Comparison by Application
5.3 Collectibles – Market size and forecast 2021-2026
Exhibit 28: Chart on Collectibles – Market size and forecast 2021-2026 ($ billion)
Exhibit 29: Data Table on Collectibles – Market size and forecast 2021-2026 ($ billion)
Exhibit 30: Chart on Collectibles – Year-over-year growth 2021-2026 (%)
Exhibit 31: Data Table on Collectibles – Year-over-year growth 2021-2026 (%)
5.4 Sports – Market size and forecast 2021-2026
Exhibit 32: Chart on Sports – Market size and forecast 2021-2026 ($ billion)
Exhibit 33: Data Table on Sports – Market size and forecast 2021-2026 ($ billion)
Exhibit 34: Chart on Sports – Year-over-year growth 2021-2026 (%)
Exhibit 35: Data Table on Sports – Year-over-year growth 2021-2026 (%)
5.5 Arts – Market size and forecast 2021-2026
Exhibit 36: Chart on Arts – Market size and forecast 2021-2026 ($ billion)
Exhibit 37: Data Table on Arts – Market size and forecast 2021-2026 ($ billion)
Exhibit 38: Chart on Arts – Year-over-year growth 2021-2026 (%)
Exhibit 39: Data Table on Arts – Year-over-year growth 2021-2026 (%)
5.6 Others – Market size and forecast 2021-2026
Exhibit 40: Chart on Others – Market size and forecast 2021-2026 ($ billion)
Exhibit 41: Data Table on Others – Market size and forecast 2021-2026 ($ billion)
Exhibit 42: Chart on Others – Year-over-year growth 2021-2026 (%)
Exhibit 43: Data Table on Others – Year-over-year growth 2021-2026 (%)
5.7 Market opportunity by Application
Exhibit 44: Market opportunity by Application ($ billion)
6. Customer landscape
6.1 Customer landscape overview
Technavio’s customer landscape matrix comparing Drivers or price sensitivity, Adoption lifecycle, importance in customer price basket, Adoption rate and Key purchase criteria
Exhibit 45: Analysis of price sensitivity, lifecycle, customer purchase basket, adoption rates, and purchase criteria
7. Geographic Landscape
7.1 Geographic segmentation
Exhibit 46: Chart on Market share by geography 2021-2026 (%)
Exhibit 47: Data Table on Market share by geography 2021-2026 (%)
7.2 Geographic comparison
Exhibit 48: Chart on Geographic comparison
Exhibit 49: Data Table on Geographic comparison
7.3 APAC – Market size and forecast 2021-2026
Exhibit 50: Chart on APAC – Market size and forecast 2021-2026 ($ billion)
Exhibit 51: Data Table on APAC – Market size and forecast 2021-2026 ($ billion)
Exhibit 52: Chart on APAC – Year-over-year growth 2021-2026 (%)
Exhibit 53: Data Table on APAC – Year-over-year growth 2021-2026 (%)
7.4 South America – Market size and forecast 2021-2026
Exhibit 54: Chart on South America – Market size and forecast 2021-2026 ($ billion)
Exhibit 55: Data Table on South America – Market size and forecast 2021-2026 ($ billion)
Exhibit 56: Chart on South America – Year-over-year growth 2021-2026 (%)
Exhibit 57: Data Table on South America – Year-over-year growth 2021-2026 (%)
7.5 Middle East and Africa – Market size and forecast 2021-2026
Exhibit 58: Chart on Middle East and Africa – Market size and forecast 2021-2026 ($ billion)
Exhibit 59: Data Table on Middle East and Africa – Market size and forecast 2021-2026 ($ billion)
Exhibit 60: Chart on Middle East and Africa – Year-over-year growth 2021-2026 (%)
Exhibit 61: Data Table on Middle East and Africa – Year-over-year growth 2021-2026 (%)
7.6 North America – Market size and forecast 2021-2026
Exhibit 62: Chart on North America – Market size and forecast 2021-2026 ($ billion)
Exhibit 63: Data Table on North America – Market size and forecast 2021-2026 ($ billion)
Exhibit 64: Chart on North America – Year-over-year growth 2021-2026 (%)
Exhibit 65: Data Table on North America – Year-over-year growth 2021-2026 (%)
7.7 Europe – Market size and forecast 2021-2026
Exhibit 66: Chart on Europe – Market size and forecast 2021-2026 ($ billion)
Exhibit 67: Data Table on Europe – Market size and forecast 2021-2026 ($ billion)
Exhibit 68: Chart on Europe – Year-over-year growth 2021-2026 (%)
Exhibit 69: Data Table on Europe – Year-over-year growth 2021-2026 (%)
7.8 Singapore – Market size and forecast 2021-2026
Exhibit 70: Chart on Singapore – Market size and forecast 2021-2026 ($ billion)
Exhibit 71: Data Table on Singapore – Market size and forecast 2021-2026 ($ billion)
Exhibit 72: Chart on Singapore – Year-over-year growth 2021-2026 (%)
Exhibit 73: Data Table on Singapore – Year-over-year growth 2021-2026 (%)
7.9 China – Market size and forecast 2021-2026
Exhibit 74: Chart on China – Market size and forecast 2021-2026 ($ billion)
Exhibit 75: Data Table on China – Market size and forecast 2021-2026 ($ billion)
Exhibit 76: Chart on China – Year-over-year growth 2021-2026 (%)
Exhibit 77: Data Table on China – Year-over-year growth 2021-2026 (%)
7.10 Venezuela – Market size and forecast 2021-2026
Exhibit 78: Chart on Venezuela – Market size and forecast 2021-2026 ($ billion)
Exhibit 79: Data Table on Venezuela – Market size and forecast 2021-2026 ($ billion)
Exhibit 80: Chart on Venezuela – Year-over-year growth 2021-2026 (%)
Exhibit 81: Data Table on Venezuela – Year-over-year growth 2021-2026 (%)
7.11 The Philippines – Market size and forecast 2021-2026
Exhibit 82: Chart on The Philippines – Market size and forecast 2021-2026 ($ billion)
Exhibit 83: Data Table on The Philippines – Market size and forecast 2021-2026 ($ billion)
Exhibit 84: Chart on The Philippines – Year-over-year growth 2021-2026 (%)
Exhibit 85: Data Table on The Philippines – Year-over-year growth 2021-2026 (%)
7.12 United Arab Emirates – Market size and forecast 2021-2026
Exhibit 86: Chart on United Arab Emirates – Market size and forecast 2021-2026 ($ billion)
Exhibit 87: Data Table on United Arab Emirates – Market size and forecast 2021-2026 ($ billion)
Exhibit 88: Chart on United Arab Emirates – Year-over-year growth 2021-2026 (%)
Exhibit 89: Data Table on United Arab Emirates – Year-over-year growth 2021-2026 (%)
7.13 Market opportunity by geography
Exhibit 90: Market opportunity by geography ($ billion)
8. Drivers, Challenges, and Trends
8.1 Market drivers
8.1.1 Increasing demand for digital artworks
8.1.2 Growing investment in digital assets
8.1.3 Security and ownership of digital assets
8.2 Market challenges
8.2.1 Uncertainty of the NFT market
8.2.2 Threat from cyberattacks
8.2.3 Legal and regulatory challenges associated with the NFT market
8.3 Impact of drivers and challenges
Exhibit 91: Impact of drivers and challenges in 2021 and 2026
8.4 Market trends
8.4.1 Growing number of big brands entering the market
8.4.2 Emergence of fractionalized NFTs
8.4.3 Growing application of AI in the market
9. Vendor Landscape
9.1 Overview
9.2 Vendor landscape
Exhibit 92: Overview on Criticality of inputs and Factors of differentiation
The potential for the disruption of the market landscape was moderate in 2020, and its threat is expected to remain unchanged by 2025.
9.3 Landscape disruption
Exhibit 93: Overview on factors of disruption
9.4 Industry risks
Exhibit 94: Impact of key risks on business
10. Vendor Analysis
10.1 Vendors covered
Exhibit 95: Vendors covered
10.2 Market positioning of vendors
Exhibit 96: Matrix on vendor position and classification
10.3 Binance Services Holdings Ltd.
Exhibit 97: Binance Services Holdings Ltd. – Overview
Exhibit 98: Binance Services Holdings Ltd. – Product / Service
Exhibit 99: Binance Services Holdings Ltd. – Key offerings
10.4 Dapper Labs Inc.
Exhibit 100: Dapper Labs Inc. – Overview
Exhibit 101: Dapper Labs Inc. – Product / Service
Exhibit 102: Dapper Labs Inc. – Key offerings
10.5 Decentraland Foundation
Exhibit 103: Decentraland Foundation – Overview
Exhibit 104: Decentraland Foundation – Product / Service
Exhibit 105: Decentraland Foundation – Key offerings
10.6 FTX Trading Ltd.
Exhibit 106: FTX Trading Ltd. – Overview
Exhibit 107: FTX Trading Ltd. – Product / Service
Exhibit 108: FTX Trading Ltd. – Key offerings
10.7 Funko Inc.
Exhibit 109: Funko Inc. – Overview
Exhibit 110: Funko Inc. – Product / Service
Exhibit 111: Funko Inc. – Key news
Exhibit 112: Funko Inc. – Key offerings
10.8 Gemini Trust Co. LLC
Exhibit 113: Gemini Trust Co. LLC – Overview
Exhibit 114: Gemini Trust Co. LLC – Product / Service
Technavio is a leading global technology research and advisory company. Their research and analysis focus on emerging market trends and provides actionable insights to help businesses identify market opportunities and develop effective strategies to optimize their market positions. With over 500 specialized analysts, Technavio’s report library consists of more than 17,000 reports and counting, covering 800 technologies, spanning across 50 countries. Their client base consists of enterprises of all sizes, including more than 100 Fortune 500 companies. This growing client base relies on Technavio’s comprehensive coverage, extensive research, and actionable market insights to identify opportunities in existing and potential markets and assess their competitive positions within changing market scenarios.
Contact
Technavio Research
Jesse Maida
Media & Marketing Executive
US: +1 844 364 1100
UK: +44 203 893 3200
Email: media@technavio.com
Website: www.technavio.com/
![]()
![]() View original content to download multimedia:https://www.prnewswire.com/news-releases/nft-market–companies-like-binance-services-holdings-ltd-offers-a-wide-range-of-nfts-such-as-alien-worlds-binance-mission-bored-pixel-en-freaky-mandrill-ape-and-more-301610940.html
View original content to download multimedia:https://www.prnewswire.com/news-releases/nft-market–companies-like-binance-services-holdings-ltd-offers-a-wide-range-of-nfts-such-as-alien-worlds-binance-mission-bored-pixel-en-freaky-mandrill-ape-and-more-301610940.html
SOURCE Technavio
