NEW YORK, Oct. 31, 2022 /PRNewswire/ — The “POS Terminals Market in the Retail Sector by Technology, Product, End-user, and Geography – Forecast and Analysis 2022-2026″ report has been added to Technavio’s offering. With ISO 9001:2015 certification, Technavio is proudly partnering with more than 100 Fortune 500 companies for over 16 years.

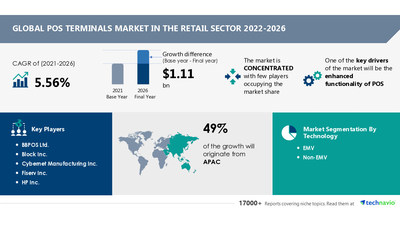
The potential growth difference for the POS terminals market size in the retail sector between 2021 and 2026 is USD 1.11 billion. To get the exact yearly growth variance and the Y-O-Y growth rate, Request a FREE PDF Sample Report
Key Market Dynamics
- Market Driver: The enhanced functionality of POS is driving market growth. Merchants in the retail sector offer the latest-generation POS terminals to provide an interactive experience to consumers. Advanced POS terminals enable merchants to plan operational savings and efficiency and focus on customer-oriented campaigns. The POS terminals in the retail sector help in the establishment of loyalty programs for customers will result in the up-selling and cross-selling of products. These programs lead to a rising loyal customer base, resulting in customer retention. Therefore, the enhancement of POS functionality will fuel the growth of the global POS terminals market in the retail sector.
- Market Challenge: There are no fixed merchant bases, which will challenge the POS terminals market in the retail sector during the forecast period. Vendors depend on customers or merchants that have very low switching costs and maintain few long-term relationships with their existing vendors. Moreover, at the time of replacement, it is not necessary for customers to choose the same vendor. This will increase the competition in the market, which can lead to price wars or consolidation. Vendors are expected to develop terminals that enable payments and secure transactions. Furthermore, developers need to obtain regional certification for specific applications. These factors will hinder the growth of companies that lack such certifications and standards.
To learn about additional key drivers, trends, and challenges available with Technavio, Read our FREE Sample Report right now!
Vendor Landscape
The POS terminals market in the retail sector is concentrated, and the vendors are deploying organic and inorganic growth strategies to compete in the market. Vendors in this market are well-established. The probability of new vendors entering the market is low due to the presence of well-established players in the market. Vendors are adopting new technologies to gain a competitive edge. The key vendors have product categories and are working on emerging technologies such as contactless payments.
This report provides a full list of key vendors, their strategies, and the latest developments. Buy Now for detailed vendor information
Market Segmentation
The POS terminals market in the retail sector report is segmented by technology (EMV and non-EMV), product (contact and contactless), end-user (supermarket, specialty store, hypermarket, gas stations, and others), and geography (APAC, North America, Europe, South America, and Middle East and Africa). APAC will be the leading region with 49% of the market’s growth during the forecast period. China, Japan, and India are the key countries for the POS terminals market in the retail sector in APAC.
Get lifetime access to our Technavio Insights! Subscribe to our Basic Plan billed annually at USD 5000
Some Companies Mentioned
- BBPOS Ltd.
- Block Inc.
- Cybernet Manufacturing Inc.
- Fiserv Inc.
- HP Inc.
- NBS Payment Solutions Inc.
- NCR Corp.
- NEC Corp.
- New POS Technology Ltd.
- Newland Digital Technology Co. Ltd.
- Oracle Corp.
- PAX Global Technology Ltd.
- Posiflex Technology Inc.
- Qashier Pte Ltd.
- Samsung Electronics Co. Ltd.
- Toshiba Corp.
- Touch Dynamic
- UIC Payworld Inc.
- VeriFone Inc.
- Worldline SA
Want your report customized? Speak to an analyst and personalize your report according to your needs
Related Reports
EMV POS Terminals Market by End-user and Geography – Forecast and Analysis 2022-2026: This report extensively covers segmentation by end-user (retail and hospitality) and geography (APAC, North America, Europe, South America, and the Middle East and Africa). 55% of the market’s growth will originate from APAC during the forecast period. The EMV market share growth by the retail segment will be significant.
Biometric POS Terminals Market by Technology and Geography – Forecast and Analysis 2021-2025: This report extensively covers segmentation by technology (fingerprint identification, palm vein identification, and others) and geography (North America, Europe, APAC, MEA, and South America). 35% of the market’s growth will originate from North America during the forecast period. The market share growth in the fingerprint identification segment will be significant.
|
POS Terminals Market Scope in the Retail Sector |
|
|
Report Coverage |
Details |
|
Page number |
120 |
|
Base year |
2021 |
|
Forecast period |
2022-2026 |
|
Growth momentum & CAGR |
Accelerate at a CAGR of 5.56% |
|
Market growth 2022-2026 |
USD 1.11 billion |
|
Market structure |
Concentrated |
|
YoY growth (%) |
4.78 |
|
Regional analysis |
APAC, North America, Europe, South America, and Middle East and Africa |
|
Performing market contribution |
APAC at 49% |
|
Key consumer countries |
US, China, India, Japan, and Germany |
|
Competitive landscape |
Leading companies, competitive strategies, consumer engagement scope |
|
Companies profiled |
BBPOS Ltd., Block Inc., Cybernet Manufacturing Inc., Fiserv Inc., HP Inc., NBS Payment Solutions Inc., NCR Corp., NEC Corp., New POS Technology Ltd., Newland Digital Technology Co. Ltd., Oracle Corp., PAX Global Technology Ltd., Posiflex Technology Inc., Qashier Pte Ltd., Samsung Electronics Co. Ltd., Toshiba Corp., Touch Dynamic, UIC Payworld Inc., VeriFone Inc., and Worldline SA |
|
Market Dynamics |
Parent market analysis, market growth inducers and obstacles, fast-growing and slow-growing segment analysis, COVID-19 impact and future consumer dynamics, and market condition analysis for the forecast period. |
|
Customization purview |
If our report has not included the data that you are looking for, you can reach out to our analysts and get segments customized. |
Browse Information Technology Market Reports
Key Topics Covered
1 Executive Summary
- 1.1 Market overview
- Exhibit 01: Executive Summary – Chart on Market Overview
- Exhibit 02: Executive Summary – Data Table on Market Overview
- Exhibit 03: Executive Summary – Chart on Global Market Characteristics
- Exhibit 04: Executive Summary – Chart on Market by Geography
- Exhibit 05: Executive Summary – Chart on Market Segmentation by Technology
- Exhibit 06: Executive Summary – Chart on Market Segmentation by Product
- Exhibit 07: Executive Summary – Chart on Market Segmentation by End-user
- Exhibit 08: Executive Summary – Chart on Incremental Growth
- Exhibit 09: Executive Summary – Data Table on Incremental Growth
- Exhibit 10: Executive Summary – Chart on Vendor Market Positioning
2 Market Landscape
- 2.1 Market ecosystem
- Exhibit 11: Parent market
- Exhibit 12: Market Characteristics
3 Market Sizing
- 3.1 Market definition
- Exhibit 13: Offerings of vendors included in the market definition
- 3.2 Market segment analysis
- Exhibit 14: Market segments
- 3.3 Market size 2021
- 3.4 Market outlook: Forecast for 2021-2026
- Exhibit 15: Chart on Global – Market size and forecast 2021-2026 ($ million)
- Exhibit 16: Data Table on Global – Market size and forecast 2021-2026 ($ million)
- Exhibit 17: Chart on Global Market: Year-over-year growth 2021-2026 (%)
- Exhibit 18: Data Table on Global Market: Year-over-year growth 2021-2026 (%)
4 Five Forces Analysis
- 4.1 Five forces summary
- Exhibit 19: Five forces analysis – Comparison between 2021 and 2026
- 4.2 Bargaining power of buyers
- Exhibit 20: Chart on Bargaining power of buyers – Impact of key factors 2021 and 2026
- 4.3 Bargaining power of suppliers
- Exhibit 21: Bargaining power of suppliers – Impact of key factors in 2021 and 2026
- 4.4 Threat of new entrants
- Exhibit 22: Threat of new entrants – Impact of key factors in 2021 and 2026
- 4.5 Threat of substitutes
- Exhibit 23: Threat of substitutes – Impact of key factors in 2021 and 2026
- 4.6 Threat of rivalry
- Exhibit 24: Threat of rivalry – Impact of key factors in 2021 and 2026
- 4.7 Market condition
- Exhibit 25: Chart on Market condition – Five forces 2021 and 2026
5 Market Segmentation by Technology
- 5.1 Market segments
- Exhibit 26: Chart on Technology – Market share 2021-2026 (%)
- Exhibit 27: Data Table on Technology – Market share 2021-2026 (%)
- 5.2 Comparison by Technology
- Exhibit 28: Chart on Comparison by Technology
- Exhibit 29: Data Table on Comparison by Technology
- 5.3 EMV – Market size and forecast 2021-2026
- Exhibit 30: Chart on EMV – Market size and forecast 2021-2026 ($ million)
- Exhibit 31: Data Table on EMV – Market size and forecast 2021-2026 ($ million)
- Exhibit 32: Chart on EMV – Year-over-year growth 2021-2026 (%)
- Exhibit 33: Data Table on EMV – Year-over-year growth 2021-2026 (%)
- 5.4 Non-EMV – Market size and forecast 2021-2026
- Exhibit 34: Chart on Non-EMV – Market size and forecast 2021-2026 ($ million)
- Exhibit 35: Data Table on Non-EMV – Market size and forecast 2021-2026 ($ million)
- Exhibit 36: Chart on Non-EMV – Year-over-year growth 2021-2026 (%)
- Exhibit 37: Data Table on Non-EMV – Year-over-year growth 2021-2026 (%)
- 5.5 Market opportunity by Technology
- Exhibit 38: Market opportunity by Technology ($ million)
6 Market Segmentation by Product
- 6.1 Market segments
- Exhibit 39: Chart on Product – Market share 2021-2026 (%)
- Exhibit 40: Data Table on Product – Market share 2021-2026 (%)
- 6.2 Comparison by Product
- Exhibit 41: Chart on Comparison by Product
- Exhibit 42: Data Table on Comparison by Product
- 6.3 Contact – Market size and forecast 2021-2026
- Exhibit 43: Chart on Contact – Market size and forecast 2021-2026 ($ million)
- Exhibit 44: Data Table on Contact – Market size and forecast 2021-2026 ($ million)
- Exhibit 45: Chart on Contact – Year-over-year growth 2021-2026 (%)
- Exhibit 46: Data Table on Contact – Year-over-year growth 2021-2026 (%)
- 6.4 Contactless – Market size and forecast 2021-2026
- Exhibit 47: Chart on Contactless – Market size and forecast 2021-2026 ($ million)
- Exhibit 48: Data Table on Contactless – Market size and forecast 2021-2026 ($ million)
- Exhibit 49: Chart on Contactless – Year-over-year growth 2021-2026 (%)
- Exhibit 50: Data Table on Contactless – Year-over-year growth 2021-2026 (%)
- 6.5 Market opportunity by Product
- Exhibit 51: Market opportunity by Product ($ million)
7 Market Segmentation by End-user
- 7.1 Market segments
- Exhibit 52: Chart on End-user – Market share 2021-2026 (%)
- Exhibit 53: Data Table on End-user – Market share 2021-2026 (%)
- 7.2 Comparison by End-user
- Exhibit 54: Chart on Comparison by End-user
- Exhibit 55: Data Table on Comparison by End-user
- 7.3 Supermarket – Market size and forecast 2021-2026
- Exhibit 56: Chart on Supermarket – Market size and forecast 2021-2026 ($ million)
- Exhibit 57: Data Table on Supermarket – Market size and forecast 2021-2026 ($ million)
- Exhibit 58: Chart on Supermarket – Year-over-year growth 2021-2026 (%)
- Exhibit 59: Data Table on Supermarket – Year-over-year growth 2021-2026 (%)
- 7.4 Specialty store – Market size and forecast 2021-2026
- Exhibit 60: Chart on Specialty store – Market size and forecast 2021-2026 ($ million)
- Exhibit 61: Data Table on Specialty store – Market size and forecast 2021-2026 ($ million)
- Exhibit 62: Chart on Specialty store – Year-over-year growth 2021-2026 (%)
- Exhibit 63: Data Table on Specialty store – Year-over-year growth 2021-2026 (%)
- 7.5 Hypermarket – Market size and forecast 2021-2026
- Exhibit 64: Chart on Hypermarket – Market size and forecast 2021-2026 ($ million)
- Exhibit 65: Data Table on Hypermarket – Market size and forecast 2021-2026 ($ million)
- Exhibit 66: Chart on Hypermarket – Year-over-year growth 2021-2026 (%)
- Exhibit 67: Data Table on Hypermarket – Year-over-year growth 2021-2026 (%)
- 7.6 Gas stations – Market size and forecast 2021-2026
- Exhibit 68: Chart on Gas stations – Market size and forecast 2021-2026 ($ million)
- Exhibit 69: Data Table on Gas stations – Market size and forecast 2021-2026 ($ million)
- Exhibit 70: Chart on Gas stations – Year-over-year growth 2021-2026 (%)
- Exhibit 71: Data Table on Gas stations – Year-over-year growth 2021-2026 (%)
- 7.7 Others – Market size and forecast 2021-2026
- Exhibit 72: Chart on Others – Market size and forecast 2021-2026 ($ million)
- Exhibit 73: Data Table on Others – Market size and forecast 2021-2026 ($ million)
- Exhibit 74: Chart on Others – Year-over-year growth 2021-2026 (%)
- Exhibit 75: Data Table on Others – Year-over-year growth 2021-2026 (%)
- 7.8 Market opportunity by End-user
- Exhibit 76: Market opportunity by End-user ($ million)
8 Customer Landscape
- 8.1 Customer landscape overview
- Exhibit 77: Analysis of price sensitivity, lifecycle, customer purchase basket, adoption rates, and purchase criteria
9 Geographic Landscape
- 9.1 Geographic segmentation
- Exhibit 78: Chart on Market share by geography 2021-2026 (%)
- Exhibit 79: Data Table on Market share by geography 2021-2026 (%)
- 9.2 Geographic comparison
- Exhibit 80: Chart on Geographic comparison
- Exhibit 81: Data Table on Geographic comparison
- 9.3 APAC – Market size and forecast 2021-2026
- Exhibit 82: Chart on APAC – Market size and forecast 2021-2026 ($ million)
- Exhibit 83: Data Table on APAC – Market size and forecast 2021-2026 ($ million)
- Exhibit 84: Chart on APAC – Year-over-year growth 2021-2026 (%)
- Exhibit 85: Data Table on APAC – Year-over-year growth 2021-2026 (%)
- 9.4 North America – Market size and forecast 2021-2026
- Exhibit 86: Chart on North America – Market size and forecast 2021-2026 ($ million)
- Exhibit 87: Data Table on North America – Market size and forecast 2021-2026 ($ million)
- Exhibit 88: Chart on North America – Year-over-year growth 2021-2026 (%)
- Exhibit 89: Data Table on North America – Year-over-year growth 2021-2026 (%)
- 9.5 Europe – Market size and forecast 2021-2026
- Exhibit 90: Chart on Europe – Market size and forecast 2021-2026 ($ million)
- Exhibit 91: Data Table on Europe – Market size and forecast 2021-2026 ($ million)
- Exhibit 92: Chart on Europe – Year-over-year growth 2021-2026 (%)
- Exhibit 93: Data Table on Europe – Year-over-year growth 2021-2026 (%)
- 9.6 South America – Market size and forecast 2021-2026
- Exhibit 94: Chart on South America – Market size and forecast 2021-2026 ($ million)
- Exhibit 95: Data Table on South America – Market size and forecast 2021-2026 ($ million)
- Exhibit 96: Chart on South America – Year-over-year growth 2021-2026 (%)
- Exhibit 97: Data Table on South America – Year-over-year growth 2021-2026 (%)
- 9.7 Middle East and Africa – Market size and forecast 2021-2026
- Exhibit 98: Chart on Middle East and Africa – Market size and forecast 2021-2026 ($ million)
- Exhibit 99: Data Table on Middle East and Africa – Market size and forecast 2021-2026 ($ million)
- Exhibit 100: Chart on Middle East and Africa – Year-over-year growth 2021-2026 (%)
- Exhibit 101: Data Table on Middle East and Africa – Year-over-year growth 2021-2026 (%)
- 9.8 China – Market size and forecast 2021-2026
- Exhibit 102: Chart on China – Market size and forecast 2021-2026 ($ million)
- Exhibit 103: Data Table on China – Market size and forecast 2021-2026 ($ million)
- Exhibit 104: Chart on China – Year-over-year growth 2021-2026 (%)
- Exhibit 105: Data Table on China – Year-over-year growth 2021-2026 (%)
- 9.9 US – Market size and forecast 2021-2026
- Exhibit 106: Chart on US – Market size and forecast 2021-2026 ($ million)
- Exhibit 107: Data Table on US – Market size and forecast 2021-2026 ($ million)
- Exhibit 108: Chart on US – Year-over-year growth 2021-2026 (%)
- Exhibit 109: Data Table on US – Year-over-year growth 2021-2026 (%)
- 9.10 India – Market size and forecast 2021-2026
- Exhibit 110: Chart on India – Market size and forecast 2021-2026 ($ million)
- Exhibit 111: Data Table on India – Market size and forecast 2021-2026 ($ million)
- Exhibit 112: Chart on India – Year-over-year growth 2021-2026 (%)
- Exhibit 113: Data Table on India – Year-over-year growth 2021-2026 (%)
- 9.11 Japan – Market size and forecast 2021-2026
- Exhibit 114: Chart on Japan – Market size and forecast 2021-2026 ($ million)
- Exhibit 115: Data Table on Japan – Market size and forecast 2021-2026 ($ million)
- Exhibit 116: Chart on Japan – Year-over-year growth 2021-2026 (%)
- Exhibit 117: Data Table on Japan – Year-over-year growth 2021-2026 (%)
- 9.12 Germany – Market size and forecast 2021-2026
- Exhibit 118: Chart on Germany – Market size and forecast 2021-2026 ($ million)
- Exhibit 119: Data Table on Germany – Market size and forecast 2021-2026 ($ million)
- Exhibit 120: Chart on Germany – Year-over-year growth 2021-2026 (%)
- Exhibit 121: Data Table on Germany – Year-over-year growth 2021-2026 (%)
- 9.13 Market opportunity by geography
- Exhibit 122: Market opportunity by geography ($ million)
10 Drivers, Challenges, and Trends
- 10.1 Market drivers
- 10.2 Market challenges
- 10.3 Impact of drivers and challenges
- Exhibit 123: Impact of drivers and challenges in 2021 and 2026
- 10.4 Market trends
11 Vendor Landscape
- 11.1 Overview
- 11.2 Vendor landscape
- Exhibit 124: Overview on Criticality of inputs and Factors of differentiation
- 11.3 Landscape disruption
- Exhibit 125: Overview on factors of disruption
- 11.4 Industry risks
- Exhibit 126: Impact of key risks on business
12 Vendor Analysis
- 12.1 Vendors covered
- Exhibit 127: Vendors covered
- 12.2 Market positioning of vendors
- Exhibit 128: Matrix on vendor position and classification
- 12.3 Cybernet Manufacturing Inc.
- Exhibit 129: Cybernet Manufacturing Inc. – Overview
- Exhibit 130: Cybernet Manufacturing Inc. – Product / Service
- Exhibit 131: Cybernet Manufacturing Inc. – Key offerings
- 12.4 NCR Corp.
- Exhibit 132: NCR Corp. – Overview
- Exhibit 133: NCR Corp. – Business segments
- Exhibit 134: NCR Corp. – Key news
- Exhibit 135: NCR Corp. – Key offerings
- Exhibit 136: NCR Corp. – Segment focus
- 12.5 NEC Corp.
- Exhibit 137: NEC Corp. – Overview
- Exhibit 138: NEC Corp. – Business segments
- Exhibit 139: NEC Corp. – Key news
- Exhibit 140: NEC Corp. – Key offerings
- Exhibit 141: NEC Corp. – Segment focus
- 12.6 Oracle Corp.
- Exhibit 142: Oracle Corp. – Overview
- Exhibit 143: Oracle Corp. – Business segments
- Exhibit 144: Oracle Corp. – Key news
- Exhibit 145: Oracle Corp. – Key offerings
- Exhibit 146: Oracle Corp. – Segment focus
- 12.7 PAX Global Technology Ltd.
- Exhibit 147: PAX Global Technology Ltd. – Overview
- Exhibit 148: PAX Global Technology Ltd. – Business segments
- Exhibit 149: PAX Global Technology Ltd. – Key offerings
- Exhibit 150: PAX Global Technology Ltd. – Segment focus
- 12.8 Posiflex Technology Inc.
- Exhibit 151: Posiflex Technology Inc. – Overview
- Exhibit 152: Posiflex Technology Inc. – Product / Service
- Exhibit 153: Posiflex Technology Inc. – Key offerings
- 12.9 Samsung Electronics Co. Ltd.
- Exhibit 154: Samsung Electronics Co. Ltd. – Overview
- Exhibit 155: Samsung Electronics Co. Ltd. – Business segments
- Exhibit 156: Samsung Electronics Co. Ltd. – Key news
- Exhibit 157: Samsung Electronics Co. Ltd. – Key offerings
- Exhibit 158: Samsung Electronics Co. Ltd. – Segment focus
- 12.10 Toshiba Corp.
- Exhibit 159: Toshiba Corp. – Overview
- Exhibit 160: Toshiba Corp. – Business segments
- Exhibit 161: Toshiba Corp. – Key news
- Exhibit 162: Toshiba Corp. – Key offerings
- Exhibit 163: Toshiba Corp. – Segment focus
- 12.11 VeriFone Inc.
- Exhibit 164: VeriFone Inc. – Overview
- Exhibit 165: VeriFone Inc. – Product / Service
- Exhibit 166: VeriFone Inc. – Key offerings
- 12.12 Worldline SA
- Exhibit 167: Worldline SA – Overview
- Exhibit 168: Worldline SA – Business segments
- Exhibit 169: Worldline SA – Key offerings
- Exhibit 170: Worldline SA – Segment focus
13 Appendix
- 13.1 Scope of the report
- 13.2 Inclusions and exclusions checklist
- Exhibit 171: Inclusions checklist
- Exhibit 172: Exclusions checklist
- 13.3 Currency conversion rates for US$
- Exhibit 173: Currency conversion rates for US$
- 13.4 Research methodology
- Exhibit 174: Research methodology
- Exhibit 175: Validation techniques employed for market sizing
- Exhibit 176: Information sources
- 13.5 List of abbreviations
- Exhibit 177: List of abbreviations
Technavio is a leading global technology research and advisory company. Their research and analysis focus on emerging market trends and provide actionable insights to help businesses identify market opportunities and develop effective strategies to optimize their market positions.
With over 500 specialized analysts, Technavio’s report library consists of more than 17,000 reports and counting, covering 800 technologies, spanning across 50 countries. Their client base consists of enterprises of all sizes, including more than 100 Fortune 500 companies. This growing client base relies on Technavio’s comprehensive coverage, extensive research, and actionable market insights to identify opportunities in existing and potential markets and assess their competitive positions within changing market scenarios.
Technavio Research
Jesse Maida
Media & Marketing Executive
US: +1 844 364 1100
UK: +44 203 893 3200
Email:media@technavio.com
Website: www.technavio.com/
![]()
![]() View original content to download multimedia:https://www.prnewswire.com/news-releases/pos-terminals-market-size-in-the-retail-sector-to-grow-by-usd-1-11-bn-enhanced-functionality-of-pos-to-boost-market-growth—technavio-301662351.html
View original content to download multimedia:https://www.prnewswire.com/news-releases/pos-terminals-market-size-in-the-retail-sector-to-grow-by-usd-1-11-bn-enhanced-functionality-of-pos-to-boost-market-growth—technavio-301662351.html
SOURCE Technavio
