NEW YORK, Jan. 30, 2023 /PRNewswire/ — According to Technavio, the global social commerce market size is estimated to grow by USD 4,196.98 billion from 2022 to 2027. The market is estimated to grow at a CAGR of almost 31% during the forecast period. APAC will account for the largest share of the global market during the forecast period.

For more Insights on market size Request a sample report
Global social commerce market – Five Forces
The global cloud data warehouse market is fragmented, and the five forces analysis covers –
- Bargaining power of buyers
- The threat of new entrants
- Threat of rivalry
- Bargaining power of suppliers
- Threat of substitutes
- Interpretation of porter’s five models helps to strategize the business, for entire details – buy the report!
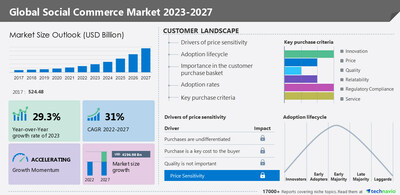
Global social commerce market – Customer Landscape
The report includes the market’s adoption lifecycle, from the innovator’s stage to the laggard’s stage. It focuses on adoption rates in different regions based on penetration. Furthermore, the report also includes key purchase criteria and drivers of price sensitivity to help companies evaluate and develop their growth strategies.
Global social commerce market – Segmentation Assessment
Segment Overview
Technavio has segmented the market based on devices (laptops and PCs, mobiles, tablets, and others), and business segments (business to consumer, business to business, and consumer to consumer).
- The laptops and PCs segment will account for a significant share of the global market during the forecast period. Though the segment accounts for the highest revenue, laptops and PCs are becoming rapidly stagnant due to the increasing adoption of wireless devices. Technological advances have increased the penetration of mobile devices, which will likely continue to hinder the growth of the market by the laptops and PCs segment during the forecast period.
Geography Overview
By geography, the global social commerce market is segmented into APAC, North America, Europe, South America, and Middle East and Africa. The report provides actionable insights and estimates the contribution of all regions to the growth of the global social commerce market.
- APAC is estimated to account for 76% of the growth of the global market during the forecast period. APAC is the major market for telecommunications owing to the large penetration of smartphones along with the increasing number of unique mobile subscribers in the region. The increasing penetration of smartphones in APAC has resulted in a high amount of data traffic in the region. This can be attributed to the developing telecommunications infrastructure and the rising availability of mobile data-centric offerings from telecommunications companies.
Global social commerce market – Market Dynamics
Key factor driving market growth
- The personalized shopping experience and diverse product portfolios on social commerce platforms is the key factor driving the market growth.
- This allows consumers to customize their searches and purchase products based on ratings and feedback. Consumer experiences and reviews of products shared by other customers have proven beneficial in online shopping.
- These platforms help users research products. Consumers can view suggestions and reviews before purchasing a product. These platforms offer diverse product portfolios that attract consumers.
- The leading categories include apparel, books, cosmetics, and electronic gadgets. The product lines of these segments are diverse and thus require regular updates. A diverse product portfolio attracts new customers and retains customer loyalty.
- The websites that register the highest number of reviews and customer feedback dominate the segment. Small players attract the customers of their rival companies through social media platforms. All these factors will result in the increased growth of the market during the forecast period.
Leading trends influencing the market
- Technological advancement in social media is the main trend driving the growth of the global social commerce market.
- Technological innovation has revolutionized social media platforms. Social media was limited to people interacting via Facebook and Twitter.
- In current scenarios, social media platforms are used for shopping and information sharing. Social interaction platforms such as Snapchat are driving the market. This is a user-friendly platform for marketing your products.
- Chatbots are computer programs that use artificial intelligence (AI) and mimic conversations. Technology engages the audience without human intervention.
- It involves users in self-initiated tasks and quasi-conversations. Technological advances will drive the market further during the forecast period.
Major challenges hindering the market growth
- The efforts required for customer engagement and retention are a major challenge to the global social commerce market growth.
- Retaining consumers is one of the major challenges faced by vendors in the online community. In offline retail stores, the staff members help the buyers in choosing the right product or engage them in a way that influences the buying decision.
- However, in social commerce, customers have complete control over their purchases. Engaging customers on online platforms is a challenge for vendors.
- If the web page or mobile application is not appealing or interactive enough, the customers can browse through other shopping sites or visit offline stores, which, in turn, will hinder growth opportunities for vendors during the forecast period.
What are the key data covered in this social commerce market report?
- CAGR of the market during the forecast period
- Detailed information on factors that will drive the growth of the Social Commerce Market between 2023 and 2027
- Precise estimation of the size of the Social Commerce Market size and its contribution to the market in focus on the parent market
- Accurate predictions about upcoming trends and changes in consumer behavior
- Growth of the Social Commerce Market industry across APAC, North America, Europe, South America, and Middle East and Africa
- A thorough analysis of the market’s competitive landscape and detailed information about vendors
- Comprehensive analysis of factors that will challenge the growth of Social Commerce Market vendors
Gain instant access to 17,000+ market research reports.
Technavio’s SUBSCRIPTION platform
Related Reports:
- The US B2C e-commerce market size is expected to increase to USD 233.66 billion from 2022 to 2027, and the market’s growth momentum will accelerate at a CAGR of 8.12%. This report extensively covers market segmentation by type (B2C retailers and classifieds), application (consumer electronics and home appliances, apparel and accessories, personal care, and others), and platform (multi-brand and single-brand).
- The size of the pharma e-commerce market in Europe is expected to increase by USD 16.42 billion from 2022 to 2027, and the market’s growth momentum will accelerate at a CAGR of 15.47%. This report extensively covers market segmentation by type (Rx and OTC), and product (medications, health wellness and nutrition, and personal care and essentials).
|
Social Commerce Market Scope |
|
|
Report Coverage |
Details |
|
Page number |
165 |
|
Base year |
2022 |
|
Historic period |
2017-2021 |
|
Forecast period |
2023-2027 |
|
Growth momentum & CAGR |
Accelerate at a CAGR of 31% |
|
Market growth 2023-2027 |
USD 4,196.98 billion |
|
Market structure |
Fragmented |
|
YoY growth 2022-2023 (%) |
29.3 |
|
Regional analysis |
APAC, North America, Europe, South America, and Middle East and Africa |
|
Performing market contribution |
APAC at 76% |
|
Key countries |
US, China, Japan, Thailand, and UK |
|
Competitive landscape |
Leading Vendors, Market Positioning of Vendors, Competitive Strategies, and Industry Risks |
|
Key companies profiled |
Advance, Alibaba Group Holding Ltd., Automattic Inc., ByteDance Ltd., Charlton Media Group, Etsy Inc., Eventbrite Inc., Fashnear Technologies Pvt. Ltd., iQIYI Inc., Meta Platforms Inc., Microsoft Corp., One97 Communications Ltd., PayPal Holdings Inc., PDD Holdings, Renren Inc., Shopify Inc., SINA Corp., Twitter Inc., Verizon Communications Inc., and Tencent Holdings Ltd. |
|
Market dynamics |
Parent market analysis, Market growth inducers and obstacles, Fast-growing and slow-growing segment analysis, COVID-19 impact and recovery analysis and future consumer dynamics, Market condition analysis for forecast period. |
|
Customization purview |
If our report has not included the data that you are looking for, you can reach out to our analysts and get segments customized. |
Table of contents
1 Executive Summary
- 1.1 Market overview
- Exhibit 01: Executive Summary – Chart on Market Overview
- Exhibit 02: Executive Summary – Data Table on Market Overview
- Exhibit 03: Executive Summary – Chart on Global Market Characteristics
- Exhibit 04: Executive Summary – Chart on Market by Geography
- Exhibit 05: Executive Summary – Chart on Market Segmentation by Device
- Exhibit 06: Executive Summary – Chart on Market Segmentation by Business Segment
- Exhibit 07: Executive Summary – Chart on Incremental Growth
- Exhibit 08: Executive Summary – Data Table on Incremental Growth
- Exhibit 09: Executive Summary – Chart on Vendor Market Positioning
2 Market Landscape
- 2.1 Market ecosystem
- Exhibit 10: Parent market
- Exhibit 11: Market Characteristics
3 Market Sizing
- 3.1 Market definition
- Exhibit 12: Offerings of vendors included in the market definition
- 3.2 Market segment analysis
- Exhibit 13: Market segments
- 3.3 Market size 2022
- 3.4 Market outlook: Forecast for 2022-2027
- Exhibit 14: Chart on Global – Market size and forecast 2022-2027 ($ billion)
- Exhibit 15: Data Table on Global – Market size and forecast 2022-2027 ($ billion)
- Exhibit 16: Chart on Global Market: Year-over-year growth 2022-2027 (%)
- Exhibit 17: Data Table on Global Market: Year-over-year growth 2022-2027 (%)
4 Historic Market Size
- 4.1 Global social commerce market 2017 – 2021
- Exhibit 18: Historic Market Size – Data Table on Global social commerce market 2017 – 2021 ($ billion)
- 4.2 Devices Segment Analysis 2017 – 2021
- Exhibit 19: Historic Market Size – Devices Segment 2017 – 2021 ($ billion)
- 4.3 Business Segment Segment Analysis 2017 – 2021
- Exhibit 20: Historic Market Size – Business Segment Segment 2017 – 2021 ($ billion)
- 4.4 Geography Segment Analysis 2017 – 2021
- Exhibit 21: Historic Market Size – Geography Segment 2017 – 2021 ($ billion)
- 4.5 Country Segment Analysis 2017 – 2021
- Exhibit 22: Historic Market Size – Country Segment 2017 – 2021 ($ billion)
5 Five Forces Analysis
- 5.1 Five forces summary
- Exhibit 23: Five forces analysis – Comparison between 2022 and 2027
- 5.2 Bargaining power of buyers
- Exhibit 24: Chart on Bargaining power of buyers – Impact of key factors 2022 and 2027
- 5.3 Bargaining power of suppliers
- Exhibit 25: Bargaining power of suppliers – Impact of key factors in 2022 and 2027
- 5.4 Threat of new entrants
- Exhibit 26: Threat of new entrants – Impact of key factors in 2022 and 2027
- 5.5 Threat of substitutes
- Exhibit 27: Threat of substitutes – Impact of key factors in 2022 and 2027
- 5.6 Threat of rivalry
- Exhibit 28: Threat of rivalry – Impact of key factors in 2022 and 2027
- 5.7 Market condition
- Exhibit 29: Chart on Market condition – Five forces 2022 and 2027
6 Market Segmentation by Device
- 6.1 Market segments
- Exhibit 30: Chart on Device – Market share 2022-2027 (%)
- Exhibit 31: Data Table on Device – Market share 2022-2027 (%)
- 6.2 Comparison by Device
- Exhibit 32: Chart on Comparison by Device
- Exhibit 33: Data Table on Comparison by Device
- 6.3 Laptops and PCs – Market size and forecast 2022-2027
- Exhibit 34: Chart on Laptops and PCs – Market size and forecast 2022-2027 ($ billion)
- Exhibit 35: Data Table on Laptops and PCs – Market size and forecast 2022-2027 ($ billion)
- Exhibit 36: Chart on Laptops and PCs – Year-over-year growth 2022-2027 (%)
- Exhibit 37: Data Table on Laptops and PCs – Year-over-year growth 2022-2027 (%)
- 6.4 Mobiles – Market size and forecast 2022-2027
- Exhibit 38: Chart on Mobiles – Market size and forecast 2022-2027 ($ billion)
- Exhibit 39: Data Table on Mobiles – Market size and forecast 2022-2027 ($ billion)
- Exhibit 40: Chart on Mobiles – Year-over-year growth 2022-2027 (%)
- Exhibit 41: Data Table on Mobiles – Year-over-year growth 2022-2027 (%)
- 6.5 Tablets – Market size and forecast 2022-2027
- Exhibit 42: Chart on Tablets – Market size and forecast 2022-2027 ($ billion)
- Exhibit 43: Data Table on Tablets – Market size and forecast 2022-2027 ($ billion)
- Exhibit 44: Chart on Tablets – Year-over-year growth 2022-2027 (%)
- Exhibit 45: Data Table on Tablets – Year-over-year growth 2022-2027 (%)
- 6.6 Others – Market size and forecast 2022-2027
- Exhibit 46: Chart on Others – Market size and forecast 2022-2027 ($ billion)
- Exhibit 47: Data Table on Others – Market size and forecast 2022-2027 ($ billion)
- Exhibit 48: Chart on Others – Year-over-year growth 2022-2027 (%)
- Exhibit 49: Data Table on Others – Year-over-year growth 2022-2027 (%)
- 6.7 Market opportunity by Device
- Exhibit 50: Market opportunity by Device ($ billion)
7 Market Segmentation by Business Segment
- 7.1 Market segments
- Exhibit 51: Chart on Market Segmentation by Business Segment – Market share 2022-2027 (%)
- Exhibit 52: Data Table on Market Segmentation by Business Segment – Market share 2022-2027 (%)
- 7.2 Comparison by Market Segmentation by Business Segment
- Exhibit 53: Chart on Comparison by Market Segmentation by Business Segment
- Exhibit 54: Data Table on Comparison by Market Segmentation by Business Segment
- 7.3 Business to consumer – Market size and forecast 2022-2027
- Exhibit 55: Chart on Business to consumer – Market size and forecast 2022-2027 ($ billion)
- Exhibit 56: Data Table on Business to consumer – Market size and forecast 2022-2027 ($ billion)
- Exhibit 57: Chart on Business to consumer – Year-over-year growth 2022-2027 (%)
- Exhibit 58: Data Table on Business to consumer – Year-over-year growth 2022-2027 (%)
- 7.4 Business to business – Market size and forecast 2022-2027
- Exhibit 59: Chart on Business to business – Market size and forecast 2022-2027 ($ billion)
- Exhibit 60: Data Table on Business to business – Market size and forecast 2022-2027 ($ billion)
- Exhibit 61: Chart on Business to business – Year-over-year growth 2022-2027 (%)
- Exhibit 62: Data Table on Business to business – Year-over-year growth 2022-2027 (%)
- 7.5 Consumer to consumer – Market size and forecast 2022-2027
- Exhibit 63: Chart on Consumer to consumer – Market size and forecast 2022-2027 ($ billion)
- Exhibit 64: Data Table on Consumer to consumer – Market size and forecast 2022-2027 ($ billion)
- Exhibit 65: Chart on Consumer to consumer – Year-over-year growth 2022-2027 (%)
- Exhibit 66: Data Table on Consumer to consumer – Year-over-year growth 2022-2027 (%)
- 7.6 Market opportunity by Market Segmentation by Business Segment
- Exhibit 67: Market opportunity by Market Segmentation by Business Segment ($ billion)
8 Customer Landscape
- 8.1 Customer landscape overview
- Exhibit 68: Analysis of price sensitivity, lifecycle, customer purchase basket, adoption rates, and purchase criteria
9 Geographic Landscape
- 9.1 Geographic segmentation
- Exhibit 69: Chart on Market share by geography 2022-2027 (%)
- Exhibit 70: Data Table on Market share by geography 2022-2027 (%)
- 9.2 Geographic comparison
- Exhibit 71: Chart on Geographic comparison
- Exhibit 72: Data Table on Geographic comparison
- 9.3 APAC – Market size and forecast 2022-2027
- Exhibit 73: Chart on APAC – Market size and forecast 2022-2027 ($ billion)
- Exhibit 74: Data Table on APAC – Market size and forecast 2022-2027 ($ billion)
- Exhibit 75: Chart on APAC – Year-over-year growth 2022-2027 (%)
- Exhibit 76: Data Table on APAC – Year-over-year growth 2022-2027 (%)
- 9.4 North America – Market size and forecast 2022-2027
- Exhibit 77: Chart on North America – Market size and forecast 2022-2027 ($ billion)
- Exhibit 78: Data Table on North America – Market size and forecast 2022-2027 ($ billion)
- Exhibit 79: Chart on North America – Year-over-year growth 2022-2027 (%)
- Exhibit 80: Data Table on North America – Year-over-year growth 2022-2027 (%)
- 9.5 Europe – Market size and forecast 2022-2027
- Exhibit 81: Chart on Europe – Market size and forecast 2022-2027 ($ billion)
- Exhibit 82: Data Table on Europe – Market size and forecast 2022-2027 ($ billion)
- Exhibit 83: Chart on Europe – Year-over-year growth 2022-2027 (%)
- Exhibit 84: Data Table on Europe – Year-over-year growth 2022-2027 (%)
- 9.6 South America – Market size and forecast 2022-2027
- Exhibit 85: Chart on South America – Market size and forecast 2022-2027 ($ billion)
- Exhibit 86: Data Table on South America – Market size and forecast 2022-2027 ($ billion)
- Exhibit 87: Chart on South America – Year-over-year growth 2022-2027 (%)
- Exhibit 88: Data Table on South America – Year-over-year growth 2022-2027 (%)
- 9.7 Middle East and Africa – Market size and forecast 2022-2027
- Exhibit 89: Chart on Middle East and Africa – Market size and forecast 2022-2027 ($ billion)
- Exhibit 90: Data Table on Middle East and Africa – Market size and forecast 2022-2027 ($ billion)
- Exhibit 91: Chart on Middle East and Africa – Year-over-year growth 2022-2027 (%)
- Exhibit 92: Data Table on Middle East and Africa – Year-over-year growth 2022-2027 (%)
- 9.8 China – Market size and forecast 2022-2027
- Exhibit 93: Chart on China – Market size and forecast 2022-2027 ($ billion)
- Exhibit 94: Data Table on China – Market size and forecast 2022-2027 ($ billion)
- Exhibit 95: Chart on China – Year-over-year growth 2022-2027 (%)
- Exhibit 96: Data Table on China – Year-over-year growth 2022-2027 (%)
- 9.9 US – Market size and forecast 2022-2027
- Exhibit 97: Chart on US – Market size and forecast 2022-2027 ($ billion)
- Exhibit 98: Data Table on US – Market size and forecast 2022-2027 ($ billion)
- Exhibit 99: Chart on US – Year-over-year growth 2022-2027 (%)
- Exhibit 100: Data Table on US – Year-over-year growth 2022-2027 (%)
- 9.10 UK – Market size and forecast 2022-2027
- Exhibit 101: Chart on UK – Market size and forecast 2022-2027 ($ billion)
- Exhibit 102: Data Table on UK – Market size and forecast 2022-2027 ($ billion)
- Exhibit 103: Chart on UK – Year-over-year growth 2022-2027 (%)
- Exhibit 104: Data Table on UK – Year-over-year growth 2022-2027 (%)
- 9.11 Japan – Market size and forecast 2022-2027
- Exhibit 105: Chart on Japan – Market size and forecast 2022-2027 ($ billion)
- Exhibit 106: Data Table on Japan – Market size and forecast 2022-2027 ($ billion)
- Exhibit 107: Chart on Japan – Year-over-year growth 2022-2027 (%)
- Exhibit 108: Data Table on Japan – Year-over-year growth 2022-2027 (%)
- 9.12 Thailand – Market size and forecast 2022-2027
- Exhibit 109: Chart on Thailand – Market size and forecast 2022-2027 ($ billion)
- Exhibit 110: Data Table on Thailand – Market size and forecast 2022-2027 ($ billion)
- Exhibit 111: Chart on Thailand – Year-over-year growth 2022-2027 (%)
- Exhibit 112: Data Table on Thailand – Year-over-year growth 2022-2027 (%)
- 9.13 Market opportunity by geography
- Exhibit 113: Market opportunity by geography ($ billion)
10 Drivers, Challenges, and Trends
- 10.1 Market drivers
- 10.2 Market challenges
- 10.3 Impact of drivers and challenges
- Exhibit 114: Impact of drivers and challenges in 2022 and 2027
- 10.4 Market trends
11 Vendor Landscape
- 11.1 Overview
- 11.2 Vendor landscape
- Exhibit 115: Overview on Criticality of inputs and Factors of differentiation
- 11.3 Landscape disruption
- Exhibit 116: Overview on factors of disruption
- 11.4 Industry risks
- Exhibit 117: Impact of key risks on business
12 Vendor Analysis
- 12.1 Vendors covered
- Exhibit 118: Vendors covered
- 12.2 Market positioning of vendors
- Exhibit 119: Matrix on vendor position and classification
- 12.3 Advance
- Exhibit 120: Advance – Overview
- Exhibit 121: Advance – Product / Service
- Exhibit 122: Advance – Key news
- Exhibit 123: Advance – Key offerings
- 12.4 Alibaba Group Holding Ltd.
- Exhibit 124: Alibaba Group Holding Ltd. – Overview
- Exhibit 125: Alibaba Group Holding Ltd. – Business segments
- Exhibit 126: Alibaba Group Holding Ltd. – Key offerings
- Exhibit 127: Alibaba Group Holding Ltd. – Segment focus
- 12.5 Automattic Inc.
- Exhibit 128: Automattic Inc. – Overview
- Exhibit 129: Automattic Inc. – Product / Service
- Exhibit 130: Automattic Inc. – Key offerings
- 12.6 Charlton Media Group
- Exhibit 131: Charlton Media Group – Overview
- Exhibit 132: Charlton Media Group – Product / Service
- Exhibit 133: Charlton Media Group – Key offerings
- 12.7 Etsy Inc.
- Exhibit 134: Etsy Inc. – Overview
- Exhibit 135: Etsy Inc. – Product / Service
- Exhibit 136: Etsy Inc. – Key offerings
- 12.8 iQIYI Inc.
- Exhibit 137: iQIYI Inc. – Overview
- Exhibit 138: iQIYI Inc. – Product / Service
- Exhibit 139: iQIYI Inc. – Key offerings
- 12.9 Meta Platforms Inc.
- Exhibit 140: Meta Platforms Inc. – Overview
- Exhibit 141: Meta Platforms Inc. – Business segments
- Exhibit 142: Meta Platforms Inc. – Key news
- Exhibit 143: Meta Platforms Inc. – Key offerings
- Exhibit 144: Meta Platforms Inc. – Segment focus
- 12.10 One97 Communications Ltd.
- Exhibit 145: One97 Communications Ltd. – Overview
- Exhibit 146: One97 Communications Ltd. – Product / Service
- Exhibit 147: One97 Communications Ltd. – Key offerings
- 12.11 PayPal Holdings Inc.
- Exhibit 148: PayPal Holdings Inc. – Overview
- Exhibit 149: PayPal Holdings Inc. – Product / Service
- Exhibit 150: PayPal Holdings Inc. – Key offerings
- 12.12 Renren Inc.
- Exhibit 151: Renren Inc. – Overview
- Exhibit 152: Renren Inc. – Key offerings
- 12.13 Shopify Inc.
- Exhibit 153: Shopify Inc. – Overview
- Exhibit 154: Shopify Inc. – Product / Service
- Exhibit 155: Shopify Inc. – Key offerings
- 12.14 SINA Corp.
- Exhibit 156: SINA Corp. – Overview
- Exhibit 157: SINA Corp. – Business segments
- Exhibit 158: SINA Corp. – Key offerings
- Exhibit 159: SINA Corp. – Segment focus
- 12.15 Tencent Holdings Ltd.
- Exhibit 160: Tencent Holdings Ltd. – Overview
- Exhibit 161: Tencent Holdings Ltd. – Business segments
- Exhibit 162: Tencent Holdings Ltd. – Key offerings
- Exhibit 163: Tencent Holdings Ltd. – Segment focus
- 12.16 Twitter Inc.
- Exhibit 164: Twitter Inc. – Overview
- Exhibit 165: Twitter Inc. – Product / Service
- Exhibit 166: Twitter Inc. – Key offerings
- 12.17 Verizon Communications Inc.
- Exhibit 167: Verizon Communications Inc. – Overview
- Exhibit 168: Verizon Communications Inc. – Business segments
- Exhibit 169: Verizon Communications Inc. – Key offerings
- Exhibit 170: Verizon Communications Inc. – Segment focus
13 Appendix
- 13.1 Scope of the report
- 13.2 Inclusions and exclusions checklist
- Exhibit 171: Inclusions checklist
- Exhibit 172: Exclusions checklist
- 13.3 Currency conversion rates for US$
- Exhibit 173: Currency conversion rates for US$
- 13.4 Research methodology
- Exhibit 174: Research methodology
- Exhibit 175: Validation techniques employed for market sizing
- Exhibit 176: Information sources
- 13.5 List of abbreviations
- Exhibit 177: List of abbreviations
About Us
Technavio is a leading global technology research and advisory company. Their research and analysis focuses on emerging market trends and provides actionable insights to help businesses identify market opportunities and develop effective strategies to optimize their market positions. With over 500 specialized analysts, Technavio’s report library consists of more than 17,000 reports and counting, covering 800 technologies, spanning across 50 countries. Their client base consists of enterprises of all sizes, including more than 100 Fortune 500 companies. This growing client base relies on Technavio’s comprehensive coverage, extensive research, and actionable market insights to identify opportunities in existing and potential markets and assess their competitive positions within changing market scenarios.
Contact
Technavio Research
Jesse Maida
Media & Marketing Executive
US: +1 844 364 1100
UK: +44 203 893 3200
Email: media@technavio.com
Website: www.technavio.com/
![]()
![]() View original content to download multimedia:https://www.prnewswire.com/news-releases/social-commerce-market-2023-2027-a-descriptive-analysis-of-five-forces-model-market-dynamics-and-segmentation–technavio-301732309.html
View original content to download multimedia:https://www.prnewswire.com/news-releases/social-commerce-market-2023-2027-a-descriptive-analysis-of-five-forces-model-market-dynamics-and-segmentation–technavio-301732309.html
SOURCE Technavio
