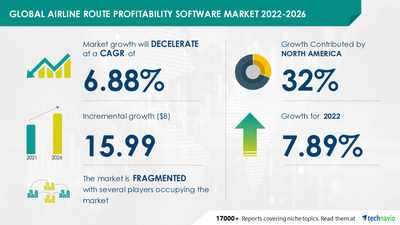
NEW YORK, Oct. 14, 2022 /PRNewswire/ — The “Airline Route Profitability Software Market by Type and Geography – Forecast and Analysis 2022-2026” report has been added to Technavio’s offering. According to the report, the market size is expected to grow by USD 15.99 billion between 2021 and 2026. However, the growth momentum is expected to decelerate at a CAGR of 6.88% during the forecast period. The report considers various aspects such as the consumer base, adoption rate, average selling price, revenue generated by vendors, and various other factors to estimate the market size. Download the Sample PDF Report Here to get an idea of the overall scope of the full report.

The global airline route profitability software market is moderately fragmented and has the presence of many global vendors providing various software suites to airlines. Vendors in the market are engaged in the development of new solutions through the integration of advanced technologies via software updates to create reliable airline schedules, thereby generating greater business value. These developments will intensify the competition in the global airline route profitability software market during the forecast period.
Technavio identifies Amadeus IT Group SA, Aerotrack Systems, Coforge Ltd., GrandTrust Overseas Pvt. Ltd., International Business Machines Corp., Laminaar Aviation Pte. Ltd., Lufthansa Group, Maureva Ltd., Maxamation Pty. Ltd., Megabyte Ltd., Optym, Orane Consulting Pvt. Ltd., Pros Inc., QlikTech International AB, Sabre GLBL Inc., Seabury Solutions, SITA, Skymetrix, The Boeing Co., and Wipro Ltd. as major market participants.
Although the growing need for advanced software suites by airlines will offer immense growth opportunities, the decline in air passenger traffic and flight cancellations will challenge the growth of the market participants. To make the most of the opportunities, market vendors should focus more on the growth prospects in the fast-growing segments, while maintaining their positions in the slow-growing segments. Request Sample Report Here
Airline Route Profitability Software Market 2022-2026: Segmentation
The global airline route profitability software market is segmented as below:
- Type
- Planning and Scheduling
- Revenue Management
- Fares Management and Pricing
- Other Software
The planning and scheduling segment accounted for the largest share of the market in 2021. Airline route planning and scheduling software can be used for schedule optimization, simulation, forecasting, route frequency optimization, and schedule editing and management. Route planning and scheduling software can be used to build, test, manage, and upload flight plans and schedules on the airline’s flight management systems (FMSs). The software also includes features that allow employees to access up-to-date data such as fuel burn, wind information, and aircraft type to construct and plan a viable flight schedule for their airline. Many such benefits are driving the demand for airline planning and scheduling software among end-users.
- Geography
- North America
- Europe
- APAC
- The Middle East and Africa
- South America
32% of the market growth will come from North America during the forecast period. Factors such as the growing connectivity of airlines and the expanding airline routes for commercial purposes are driving the growth of the regional market. In addition, the increasing air passenger traffic and the development of new aircraft in countries such as the US and Canada are contributing to the growth of the airline route profitability software market in North America.
Technavio presents a detailed picture of the market by the way of study, synthesis, and summation of data from multiple sources. Our airline route profitability software market report covers the following areas:
- Airline Route Profitability Software Market Size
- Airline Route Profitability Software Market Trends
- Airline Route Profitability Software Market Industry Analysis
Airline Route Profitability Software Market 2022-2026: Vendor Analysis
We provide a detailed analysis of around 25 vendors operating in the airline route profitability software market, including some of the dominant vendors. Backed with competitive intelligence and benchmarking, our research report on the airline route profitability software market is designed to provide entry support, customer profile, and M&As as well as go-to-market strategy support.
Airline Route Profitability Software Market 2022-2026: Key Highlights
- CAGR of the market during the forecast period 2022-2026
- Detailed information on factors that will assist airline route profitability software market growth during the next five years
- Estimation of the airline route profitability software market size and its contribution to the parent market
- Predictions on upcoming trends and changes in consumer behavior
- The growth of the airline route profitability software market
- Analysis of the market’s competitive landscape and detailed information on vendors
- Comprehensive details of factors that will challenge the growth of airline route profitability software market vendors
Related Reports:
- Aircraft Switches Market by End-user and Geography – Forecast and Analysis 2022-2026
- Advanced-Surface Movement Guidance and Control System (A-SMGCS) Market by Application and Geography – Forecast and Analysis 2021-2025
|
Airline Route Profitability Software Market Scope |
|
|
Report Coverage |
Details |
|
Page number |
120 |
|
Base year |
2021 |
|
Forecast period |
2022-2026 |
|
Growth momentum & CAGR |
Decelerate at a CAGR of 6.88% |
|
Market growth 2022-2026 |
USD 15.99 billion |
|
Market structure |
Fragmented |
|
YoY growth (%) |
7.89 |
|
Regional analysis |
North America, Europe, APAC, Middle East and Africa, and South America |
|
Performing market contribution |
North America at 32% |
|
Key consumer countries |
US, China, UK, France, and Germany |
|
Competitive landscape |
Leading companies, competitive strategies, consumer engagement scope |
|
Companies profiled |
Amadeus IT Group SA, Aerotrack Systems, Coforge Ltd., GrandTrust Overseas Pvt. Ltd., International Business Machines Corp., Laminaar Aviation Pte. Ltd., Lufthansa Group, Maureva Ltd., Maxamation Pty. Ltd., Megabyte Ltd., Optym, Orane Consulting Pvt. Ltd., Pros Inc., QlikTech International AB, Sabre GLBL Inc., Seabury Solutions, SITA, Skymetrix, The Boeing Co., and Wipro Ltd. |
|
Market Dynamics |
Parent market analysis, Market growth inducers and obstacles, Fast-growing and slow-growing segment analysis, COVID-19 impact and future consumer dynamics, and market condition analysis for the forecast period. |
|
Customization purview |
If our report has not included the data that you are looking for, you can reach out to our analysts and get segments customized. |
Table Of Contents:
1 Executive Summary
- 1.1 Market overview
- Exhibit 01: Executive Summary – Chart on Market Overview
- Exhibit 02: Executive Summary – Data Table on Market Overview
- Exhibit 03: Executive Summary – Chart on Global Market Characteristics
- Exhibit 04: Executive Summary – Chart on Market by Geography
- Exhibit 05: Executive Summary – Chart on Market Segmentation by Type
- Exhibit 06: Executive Summary – Chart on Incremental Growth
- Exhibit 07: Executive Summary – Data Table on Incremental Growth
- Exhibit 08: Executive Summary – Chart on Vendor Market Positioning
2 Market Landscape
- 2.1 Market ecosystem
- Exhibit 09: Parent market
- Exhibit 10: Market Characteristics
3 Market Sizing
- 3.1 Market definition
- Exhibit 11: Offerings of vendors included in the market definition
- 3.2 Market segment analysis
- Exhibit 12: Market segments
- 3.3 Market size 2021
- 3.4 Market outlook: Forecast for 2021-2026
- Exhibit 13: Chart on Global – Market size and forecast 2021-2026 ($ million)
- Exhibit 14: Data Table on Global – Market size and forecast 2021-2026 ($ million)
- Exhibit 15: Chart on Global Market: Year-over-year growth 2021-2026 (%)
- Exhibit 16: Data Table on Global Market: Year-over-year growth 2021-2026 (%)
4 Five Forces Analysis
- 4.1 Five forces summary
- Exhibit 17: Five forces analysis – Comparison between 2021 and 2026
- 4.2 Bargaining power of buyers
- Exhibit 18: Chart on Bargaining power of buyers – Impact of key factors 2021 and 2026
- 4.3 Bargaining power of suppliers
- Exhibit 19: Bargaining power of suppliers – Impact of key factors in 2021 and 2026
- 4.4 Threat of new entrants
- Exhibit 20: Threat of new entrants – Impact of key factors in 2021 and 2026
- 4.5 Threat of substitutes
- Exhibit 21: Threat of substitutes – Impact of key factors in 2021 and 2026
- 4.6 Threat of rivalry
- Exhibit 22: Threat of rivalry – Impact of key factors in 2021 and 2026
- 4.7 Market condition
- Exhibit 23: Chart on Market condition – Five forces 2021 and 2026
5 Market Segmentation by Type
- 5.1 Market segments
- Exhibit 24: Chart on Type – Market share 2021-2026 (%)
- Exhibit 25: Data Table on Type – Market share 2021-2026 (%)
- 5.2 Comparison by Type
- Exhibit 26: Chart on Comparison by Type
- Exhibit 27: Data Table on Comparison by Type
- 5.3 Planning and Scheduling – Market size and forecast 2021-2026
- Exhibit 28: Chart on Planning and Scheduling – Market size and forecast 2021-2026 ($ million)
- Exhibit 29: Data Table on Planning and Scheduling – Market size and forecast 2021-2026 ($ million)
- Exhibit 30: Chart on Planning and Scheduling – Year-over-year growth 2021-2026 (%)
- Exhibit 31: Data Table on Planning and Scheduling – Year-over-year growth 2021-2026 (%)
- 5.4 Revenue Management – Market size and forecast 2021-2026
- Exhibit 32: Chart on Revenue Management – Market size and forecast 2021-2026 ($ million)
- Exhibit 33: Data Table on Revenue Management – Market size and forecast 2021-2026 ($ million)
- Exhibit 34: Chart on Revenue Management – Year-over-year growth 2021-2026 (%)
- Exhibit 35: Data Table on Revenue Management – Year-over-year growth 2021-2026 (%)
- 5.5 Fares Management and Pricing – Market size and forecast 2021-2026
- Exhibit 36: Chart on Fares Management and Pricing – Market size and forecast 2021-2026 ($ million)
- Exhibit 37: Data Table on Fares Management and Pricing – Market size and forecast 2021-2026 ($ million)
- Exhibit 38: Chart on Fares Management and Pricing – Year-over-year growth 2021-2026 (%)
- Exhibit 39: Data Table on Fares Management and Pricing – Year-over-year growth 2021-2026 (%)
- 5.6 Other Software – Market size and forecast 2021-2026
- Exhibit 40: Chart on Other Software – Market size and forecast 2021-2026 ($ million)
- Exhibit 41: Data Table on Other Software – Market size and forecast 2021-2026 ($ million)
- Exhibit 42: Chart on Other Software – Year-over-year growth 2021-2026 (%)
- Exhibit 43: Data Table on Other Software – Year-over-year growth 2021-2026 (%)
- 5.7 Market opportunity by Type
- Exhibit 44: Market opportunity by Type ($ million)
6 Customer Landscape
- 6.1 Customer landscape overview
- Exhibit 45: Analysis of price sensitivity, lifecycle, customer purchase basket, adoption rates, and purchase criteria
7 Geographic Landscape
- 7.1 Geographic segmentation
- Exhibit 46: Chart on Market share by geography 2021-2026 (%)
- Exhibit 47: Data Table on Market share by geography 2021-2026 (%)
- 7.2 Geographic comparison
- Exhibit 48: Chart on Geographic comparison
- Exhibit 49: Data Table on Geographic comparison
- 7.3 North America – Market size and forecast 2021-2026
- Exhibit 50: Chart on North America – Market size and forecast 2021-2026 ($ million)
- Exhibit 51: Data Table on North America – Market size and forecast 2021-2026 ($ million)
- Exhibit 52: Chart on North America – Year-over-year growth 2021-2026 (%)
- Exhibit 53: Data Table on North America – Year-over-year growth 2021-2026 (%)
- 7.4 Europe – Market size and forecast 2021-2026
- Exhibit 54: Chart on Europe – Market size and forecast 2021-2026 ($ million)
- Exhibit 55: Data Table on Europe – Market size and forecast 2021-2026 ($ million)
- Exhibit 56: Chart on Europe – Year-over-year growth 2021-2026 (%)
- Exhibit 57: Data Table on Europe – Year-over-year growth 2021-2026 (%)
- 7.5 APAC – Market size and forecast 2021-2026
- Exhibit 58: Chart on APAC – Market size and forecast 2021-2026 ($ million)
- Exhibit 59: Data Table on APAC – Market size and forecast 2021-2026 ($ million)
- Exhibit 60: Chart on APAC – Year-over-year growth 2021-2026 (%)
- Exhibit 61: Data Table on APAC – Year-over-year growth 2021-2026 (%)
- 7.6 Middle East and Africa – Market size and forecast 2021-2026
- Exhibit 62: Chart on Middle East and Africa – Market size and forecast 2021-2026 ($ million)
- Exhibit 63: Data Table on Middle East and Africa – Market size and forecast 2021-2026 ($ million)
- Exhibit 64: Chart on Middle East and Africa – Year-over-year growth 2021-2026 (%)
- Exhibit 65: Data Table on Middle East and Africa – Year-over-year growth 2021-2026 (%)
- 7.7 South America – Market size and forecast 2021-2026
- Exhibit 66: Chart on South America – Market size and forecast 2021-2026 ($ million)
- Exhibit 67: Data Table on South America – Market size and forecast 2021-2026 ($ million)
- Exhibit 68: Chart on South America – Year-over-year growth 2021-2026 (%)
- Exhibit 69: Data Table on South America – Year-over-year growth 2021-2026 (%)
- 7.8 US – Market size and forecast 2021-2026
- Exhibit 70: Chart on US – Market size and forecast 2021-2026 ($ million)
- Exhibit 71: Data Table on US – Market size and forecast 2021-2026 ($ million)
- Exhibit 72: Chart on US – Year-over-year growth 2021-2026 (%)
- Exhibit 73: Data Table on US – Year-over-year growth 2021-2026 (%)
- 7.9 China – Market size and forecast 2021-2026
- Exhibit 74: Chart on China – Market size and forecast 2021-2026 ($ million)
- Exhibit 75: Data Table on China – Market size and forecast 2021-2026 ($ million)
- Exhibit 76: Chart on China – Year-over-year growth 2021-2026 (%)
- Exhibit 77: Data Table on China – Year-over-year growth 2021-2026 (%)
- 7.10 UK – Market size and forecast 2021-2026
- Exhibit 78: Chart on UK – Market size and forecast 2021-2026 ($ million)
- Exhibit 79: Data Table on UK – Market size and forecast 2021-2026 ($ million)
- Exhibit 80: Chart on UK – Year-over-year growth 2021-2026 (%)
- Exhibit 81: Data Table on UK – Year-over-year growth 2021-2026 (%)
- 7.11 France – Market size and forecast 2021-2026
- Exhibit 82: Chart on France – Market size and forecast 2021-2026 ($ million)
- Exhibit 83: Data Table on France – Market size and forecast 2021-2026 ($ million)
- Exhibit 84: Chart on France – Year-over-year growth 2021-2026 (%)
- Exhibit 85: Data Table on France – Year-over-year growth 2021-2026 (%)
- 7.12 Germany – Market size and forecast 2021-2026
- Exhibit 86: Chart on Germany – Market size and forecast 2021-2026 ($ million)
- Exhibit 87: Data Table on Germany – Market size and forecast 2021-2026 ($ million)
- Exhibit 88: Chart on Germany – Year-over-year growth 2021-2026 (%)
- Exhibit 89: Data Table on Germany – Year-over-year growth 2021-2026 (%)
- 7.13 Market opportunity by geography
- Exhibit 90: Market opportunity by geography ($ million)
8 Drivers, Challenges, and Trends
- 8.1 Market drivers
- 8.2 Market challenges
- 8.3 Impact of drivers and challenges
- Exhibit 91: Impact of drivers and challenges in 2021 and 2026
- 8.4 Market trends
9 Vendor Landscape
- 9.1 Overview
- 9.2 Vendor landscape
- Exhibit 92: Overview on Criticality of inputs and Factors of differentiation
- 9.3 Landscape disruption
- Exhibit 93: Overview on factors of disruption
- 9.4 Industry risks
- Exhibit 94: Impact of key risks on business
10 Vendor Analysis
- 10.1 Vendors covered
- Exhibit 95: Vendors covered
- 10.2 Market positioning of vendors
- Exhibit 96: Matrix on vendor position and classification
- 10.3 Amadeus IT Group SA
- Exhibit 97: Amadeus IT Group SA – Overview
- Exhibit 98: Amadeus IT Group SA – Business segments
- Exhibit 99: Amadeus IT Group SA – Key news
- Exhibit 100: Amadeus IT Group SA – Key offerings
- Exhibit 101: Amadeus IT Group SA – Segment focus
- 10.4 Coforge Ltd.
- Exhibit 102: Coforge Ltd. – Overview
- Exhibit 103: Coforge Ltd. – Business segments
- Exhibit 104: Coforge Ltd. – Key news
- Exhibit 105: Coforge Ltd. – Key offerings
- Exhibit 106: Coforge Ltd. – Segment focus
- 10.5 International Business Machines Corp.
- Exhibit 107: International Business Machines Corp. – Overview
- Exhibit 108: International Business Machines Corp. – Business segments
- Exhibit 109: International Business Machines Corp. – Key offerings
- Exhibit 110: International Business Machines Corp. – Segment focus
- 10.6 Laminaar Aviation Pte. Ltd.
- Exhibit 111: Laminaar Aviation Pte. Ltd. – Overview
- Exhibit 112: Laminaar Aviation Pte. Ltd. – Product / Service
- Exhibit 113: Laminaar Aviation Pte. Ltd. – Key offerings
- 10.7 Megabyte Ltd.
- Exhibit 114: Megabyte Ltd. – Overview
- Exhibit 115: Megabyte Ltd. – Product / Service
- Exhibit 116: Megabyte Ltd. – Key offerings
- 10.8 Orane Consulting Pvt. Ltd.
- Exhibit 117: Orane Consulting Pvt. Ltd. – Overview
- Exhibit 118: Orane Consulting Pvt. Ltd. – Product / Service
- Exhibit 119: Orane Consulting Pvt. Ltd. – Key offerings
- 10.9 Sabre GLBL Inc.
- Exhibit 120: Sabre GLBL Inc. – Overview
- Exhibit 121: Sabre GLBL Inc. – Business segments
- Exhibit 122: Sabre GLBL Inc. – Key news
- Exhibit 123: Sabre GLBL Inc. – Key offerings
- Exhibit 124: Sabre GLBL Inc. – Segment focus
- 10.10 Seabury Solutions
- Exhibit 125: Seabury Solutions – Overview
- Exhibit 126: Seabury Solutions – Product / Service
- Exhibit 127: Seabury Solutions – Key offerings
- 10.11 SITA
- Exhibit 128: SITA – Overview
- Exhibit 129: SITA – Product / Service
- Exhibit 130: SITA – Key offerings
- 10.12 Skymetrix
- Exhibit 131: Skymetrix – Overview
- Exhibit 132: Skymetrix – Product / Service
- Exhibit 133: Skymetrix – Key offerings
11 Appendix
- 11.1 Scope of the report
- 11.2 Inclusions and exclusions checklist
- Exhibit 134: Inclusions checklist
- Exhibit 135: Exclusions checklist
- 11.3 Currency conversion rates for US$
- Exhibit 136: Currency conversion rates for US$
- 11.4 Research methodology
- Exhibit 137: Research methodology
- Exhibit 138: Validation techniques employed for market sizing
- Exhibit 139: Information sources
- 11.5 List of abbreviations
- Exhibit 140: List of abbreviations
Technavio is a leading global technology research and advisory company. Their research and analysis focus on emerging market trends and provides actionable insights to help businesses identify market opportunities and develop effective strategies to optimize their market positions. With over 500 specialized analysts, Technavio’s report library consists of more than 17,000 reports and counting, covering 800 technologies, spanning across 50 countries. Their client base consists of enterprises of all sizes, including more than 100 Fortune 500 companies. This growing client base relies on Technavio’s comprehensive coverage, extensive research, and actionable market insights to identify opportunities in existing and potential markets and assess their competitive positions within changing market scenarios.
Technavio Research
Jesse Maida
Media & Marketing Executive
US: +1 844 364 1100
UK: +44 203 893 3200
Email: media@technavio.com
Website: www.technavio.com/
![]()
![]() View original content to download multimedia:https://www.prnewswire.com/news-releases/airline-route-profitability-software-market-to-record-usd-15-99-bn-incremental-growth-north-america-to-have-a-significant-market-share–technavio-301648920.html
View original content to download multimedia:https://www.prnewswire.com/news-releases/airline-route-profitability-software-market-to-record-usd-15-99-bn-incremental-growth-north-america-to-have-a-significant-market-share–technavio-301648920.html
SOURCE Technavio
