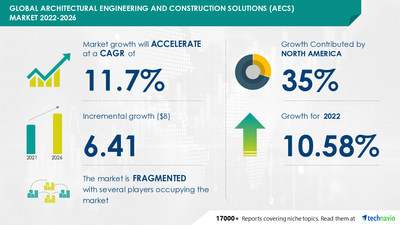
NEW YORK, Oct. 17, 2022 /PRNewswire/ — Technavio has been monitoring the architectural engineering and construction solutions (AECS) market, operating in the IT software industry. The report estimates it to register an incremental growth of USD 6.41 billion, at a CAGR of 11.7% during the forecast period. The global AECS market is characterized by the presence of well-diversified international and regional vendors. Competitors have to focus on performance, innovation, cost, and financial stability to strengthen their foothold in the market. Market vendors also have to leverage the existing growth prospects in the fast-growing segments, while maintaining their positions in the slow-growing segments. Request Free Sample Report.
 Market 2022-2026")
We provide a detailed analysis of around 25 vendors operating in the Architectural Engineering and Construction Solutions (AECS) Market, including some of the vendors such as vendors Backed with competitive intelligence and benchmarking, our research reports on the Architectural Engineering and Construction Solutions (AECS) Market are designed to provide entry support, customer profile and M&As as well as go-to-market strategy support.
- 4M Group
- ACCA software Spa
- ANSYS Inc.
- Autodesk Inc
- AVEVA Group Plc
- Bentley Systems Inc.
- CYPE Ingenieros SA
- Dassault Systemes SE
- Esri
- GEOTEC Software Inc.
- Hexagon AB
- Innovaya LLC
- Integrated Environmental Solutions Ltd.
- Nemetschek SE
- Newforma Inc.
- Oracle Corp.
- Procore Technologies Inc.
- Trimble Inc.
- Virtual Build Technologies
- Construsoft B.V.
Find additional highlights on the growth strategies adopted by vendors and their product offerings, Download a Sample Report.
The increasing need for managing large-scale projects is notably driving the architectural engineering and construction solutions (AECS) market growth. Currently, organizations are focusing on cultivating and managing the resources necessary for efficient product output, which increases the need for efficient solutions for the management of large-scale construction projects. The primary purpose of AECS is to automate processes to ensure maximized output by managing resources and maintaining regular follow-up. Automated services increase connectivity so that organizations can handle project-related inquiries easily and effectively. Also, automation decreases response time and increases productivity, which ensures efficient process management. By using AEC solutions, revenue possibilities can be rapidly increased by calculating conversion ratios and running reports to track the metrics detailed as per customer demand. These features reduce the operating time. Thus, such benefits associated with the adoption of AECS will drive the growth of the market in focus during the forecast period.
The challenges associated with open-source platforms is the major challenge impeding the architectural engineering and construction solutions (AECS) market growth. With the rising demand for digitalization in the current market scenario, the demand for open-source software has increased in the market. Open-source vendors provide a wide range of business analytics tools and applications. These types of feature-rich software are freely available on the Internet. Hence, several small and emerging enterprises use them, as the purchasing and licensing costs of commercial software are high. Also, the primary and common features that are provided in the proprietary are available in most of the open-source AECS. Open-source software can be downloaded and run on all platforms, posing stiff competition to commercial BIM software. Free BIM viewer, Standard office application-based BIM, BIM software toolkit, BIM as a bolt-on for CAD software, BIMx from GRAPHISOFT, BuildTools, eSUB, Estimator Application, and GenieBelt are some of the common open-source AEC solutions available in the market. Open-source platforms can be easily tested before implementation, and this makes them suitable for rapid prototyping and experimentation. In addition, open-source platforms are peer-reviewed software, which leads to better reliability. Thus, such factors might hamper the growth of the global AECS market during the forecast period.
To know about the additional drivers and challenges. Request a Sample Report
Based on geographic segmentation, 35% of the market’s growth originated from North America during the forecast period. In addition, software led the growth of the product segment. This report provides an accurate prediction of the contribution of all the segments to the growth of the superfood powders market size.
- Product
- Software
- Services
- Deployment
- On-premise
- Cloud-based
- Geography
- North America
- Europe
- APAC
- South America
- Middle East And Africa
- Architectural Engineering and Construction Solutions (AECS) Market Size
- Architectural Engineering and Construction Solutions (AECS) Market Trends
- Architectural Engineering and Construction Solutions (AECS) Market Industry Analysis
- CAGR of the market during the forecast period 2022-2026
- Detailed information on factors that will assist architectural engineering and construction solutions (AECS) market growth during the next five years
- Estimation of the architectural engineering and construction solutions (AECS) market size and its contribution to the parent market
- Predictions on upcoming trends and changes in consumer behavior
- The growth of the architectural engineering and construction solutions (AECS) market
- Analysis of the market’s competitive landscape and detailed information on vendors
- Comprehensive details of factors that will challenge the growth of the architectural engineering and construction solutions (AECS) market, vendors
Oil and Gas Engineering Services Market by Type and Geography – Forecast and Analysis 2022-2026
|
Architectural Engineering And Construction Solutions (AECS) Market Scope |
|
|
Report Coverage |
Details |
|
Page number |
120 |
|
Base year |
2021 |
|
Forecast period |
2022-2026 |
|
Growth momentum & CAGR |
Accelerate at a CAGR of 11.7% |
|
Market growth 2022-2026 |
USD 6.41 billion |
|
Market structure |
Fragmented |
|
YoY growth (%) |
10.58 |
|
Regional analysis |
North America, Europe, APAC, South America, and Middle East and Africa |
|
Performing market contribution |
North America at 35% |
|
Key consumer countries |
US, China, Japan, UK, and France |
|
Competitive landscape |
Leading companies, competitive strategies, consumer engagement scope |
|
Companies profiled |
4M Group, ACCA software Spa, ANSYS Inc., Autodesk Inc, AVEVA Group Plc, Bentley Systems Inc., CYPE Ingenieros SA, Dassault Systemes SE, Esri, GEOTEC Software Inc., Hexagon AB, Innovaya LLC, Integrated Environmental Solutions Ltd., Nemetschek SE, Newforma Inc., Oracle Corp., Procore Technologies Inc., Trimble Inc., Virtual Build Technologies, and Construsoft B.V. |
|
Market Dynamics |
Parent market analysis, Market growth inducers and obstacles, Fast-growing and slow-growing segment analysis, COVID-19 impact and future consumer dynamics, and market condition analysis for the forecast period. |
|
Customization purview |
If our report has not included the data that you are looking for, you can reach out to our analysts and get segments customized. |
1 Executive Summary
- 1.1 Market Overview
- Exhibit 01: Executive Summary – Chart on Market Overview
- Exhibit 02: Executive Summary – Data Table on Market Overview
- Exhibit 03: Executive Summary – Chart on Global Market Characteristics
- Exhibit 04: Executive Summary – Chart on Market by Geography
- Exhibit 05: Executive Summary – Chart on Market Segmentation by Product
- Exhibit 06: Executive Summary – Chart on Market Segmentation by Deployment
- Exhibit 07: Executive Summary – Chart on Incremental Growth
- Exhibit 08: Executive Summary – Data Table on Incremental Growth
- Exhibit 09: Executive Summary – Chart on Vendor Market Positioning
2 Market Landscape
- 2.1 Market ecosystem
- Exhibit 10: Parent market
- Exhibit 11: Market Characteristics
3 Market Sizing
- 3.1 Market definition
- Exhibit 12: Offerings of vendors included in the market definition
- 3.2 Market segment analysis
- Exhibit 13: Market segments
- 3.3 Market size 2021
- 3.4 Market outlook: Forecast for 2021-2026
- Exhibit 14: Chart on Global – Market size and forecast 2021-2026 ($ million)
- Exhibit 15: Data Table on Global – Market size and forecast 2021-2026 ($ million)
- Exhibit 16: Chart on Global Market: Year-over-year growth 2021-2026 (%)
- Exhibit 17: Data Table on Global Market: Year-over-year growth 2021-2026 (%)
4 Five Forces Analysis
- 4.1 Five forces summary
- Exhibit 18: Five forces analysis – Comparison between 2021 and 2026
- 4.2 Bargaining power of buyers
- Exhibit 19: Chart on Bargaining power of buyers – Impact of key factors 2021 and 2026
- 4.3 Bargaining power of suppliers
- Exhibit 20: Bargaining power of suppliers – Impact of key factors in 2021 and 2026
- 4.4 Threat of new entrants
- Exhibit 21: Threat of new entrants – Impact of key factors in 2021 and 2026
- 4.5 Threat of substitutes
- Exhibit 22: Threat of substitutes – Impact of key factors in 2021 and 2026
- 4.6 Threat of rivalry
- Exhibit 23: Threat of rivalry – Impact of key factors in 2021 and 2026
- 4.7 Market condition
- Exhibit 24: Chart on Market condition – Five forces 2021 and 2026
5 Market Segmentation by Product
- 5.1 Market segments
- Exhibit 25: Chart on Product – Market share 2021-2026 (%)
- Exhibit 26: Data Table on Product – Market share 2021-2026 (%)
- 5.2 Comparison by Product
- Exhibit 27: Chart on Comparison by Product
- Exhibit 28: Data Table on Comparison by Product
- 5.3 Software – Market size and forecast 2021-2026
- Exhibit 29: Chart on Software – Market size and forecast 2021-2026 ($ million)
- Exhibit 30: Data Table on Software – Market size and forecast 2021-2026 ($ million)
- Exhibit 31: Chart on Software – Year-over-year growth 2021-2026 (%)
- Exhibit 32: Data Table on Software – Year-over-year growth 2021-2026 (%)
- 5.4 Services – Market size and forecast 2021-2026
- Exhibit 33: Chart on Services – Market size and forecast 2021-2026 ($ million)
- Exhibit 34: Data Table on Services – Market size and forecast 2021-2026 ($ million)
- Exhibit 35: Chart on Services – Year-over-year growth 2021-2026 (%)
- Exhibit 36: Data Table on Services – Year-over-year growth 2021-2026 (%)
- 5.5 Market opportunity by Product
- Exhibit 37: Market opportunity by Product ($ million)
6 Market Segmentation by Deployment
- 6.1 Market segments
- Exhibit 38: Chart on Deployment – Market share 2021-2026 (%)
- Exhibit 39: Data Table on Deployment – Market share 2021-2026 (%)
- 6.2 Comparison by Deployment
- Exhibit 40: Chart on Comparison by Deployment
- Exhibit 41: Data Table on Comparison by Deployment
- 6.3 On-premise – Market size and forecast 2021-2026
- Exhibit 42: Chart on On-premise – Market size and forecast 2021-2026 ($ million)
- Exhibit 43: Data Table on On-premise – Market size and forecast 2021-2026 ($ million)
- Exhibit 44: Chart on On-premise – Year-over-year growth 2021-2026 (%)
- Exhibit 45: Data Table on On-premise – Year-over-year growth 2021-2026 (%)
- 6.4 Cloud-based – Market size and forecast 2021-2026
- Exhibit 46: Chart on Cloud-based – Market size and forecast 2021-2026 ($ million)
- Exhibit 47: Data Table on Cloud-based – Market size and forecast 2021-2026 ($ million)
- Exhibit 48: Chart on Cloud-based – Year-over-year growth 2021-2026 (%)
- Exhibit 49: Data Table on Cloud-based – Year-over-year growth 2021-2026 (%)
- 6.5 Market opportunity by Deployment
- Exhibit 50: Market opportunity by Deployment ($ million)
7 Customer Landscape
- 7.1 Customer landscape overview
- Exhibit 51: Analysis of price sensitivity, lifecycle, customer purchase basket, adoption rates, and purchase criteria
8 Geographic Landscape
- 8.1 Geographic segmentation
- Exhibit 52: Chart on Market share by geography 2021-2026 (%)
- Exhibit 53: Data Table on Market share by geography 2021-2026 (%)
- 8.2 Geographic comparison
- Exhibit 54: Chart on Geographic comparison
- Exhibit 55: Data Table on Geographic comparison
- 8.3 North America – Market size and forecast 2021-2026
- Exhibit 56: Chart on North America – Market size and forecast 2021-2026 ($ million)
- Exhibit 57: Data Table on North America – Market size and forecast 2021-2026 ($ million)
- Exhibit 58: Chart on North America – Year-over-year growth 2021-2026 (%)
- Exhibit 59: Data Table on North America – Year-over-year growth 2021-2026 (%)
- 8.4 Europe – Market size and forecast 2021-2026
- Exhibit 60: Chart on Europe – Market size and forecast 2021-2026 ($ million)
- Exhibit 61: Data Table on Europe – Market size and forecast 2021-2026 ($ million)
- Exhibit 62: Chart on Europe – Year-over-year growth 2021-2026 (%)
- Exhibit 63: Data Table on Europe – Year-over-year growth 2021-2026 (%)
- 8.5 APAC – Market size and forecast 2021-2026
- Exhibit 64: Chart on APAC – Market size and forecast 2021-2026 ($ million)
- Exhibit 65: Data Table on APAC – Market size and forecast 2021-2026 ($ million)
- Exhibit 66: Chart on APAC – Year-over-year growth 2021-2026 (%)
- Exhibit 67: Data Table on APAC – Year-over-year growth 2021-2026 (%)
- 8.6 South America – Market size and forecast 2021-2026
- Exhibit 68: Chart on South America – Market size and forecast 2021-2026 ($ million)
- Exhibit 69: Data Table on South America – Market size and forecast 2021-2026 ($ million)
- Exhibit 70: Chart on South America – Year-over-year growth 2021-2026 (%)
- Exhibit 71: Data Table on South America – Year-over-year growth 2021-2026 (%)
- 8.7 Middle East and Africa – Market size and forecast 2021-2026
- Exhibit 72: Chart on Middle East and Africa – Market size and forecast 2021-2026 ($ million)
- Exhibit 73: Data Table on Middle East and Africa – Market size and forecast 2021-2026 ($ million)
- Exhibit 74: Chart on Middle East and Africa – Year-over-year growth 2021-2026 (%)
- Exhibit 75: Data Table on Middle East and Africa – Year-over-year growth 2021-2026 (%)
- 8.8 US – Market size and forecast 2021-2026
- Exhibit 76: Chart on US – Market size and forecast 2021-2026 ($ million)
- Exhibit 77: Data Table on US – Market size and forecast 2021-2026 ($ million)
- Exhibit 78: Chart on US – Year-over-year growth 2021-2026 (%)
- Exhibit 79: Data Table on US – Year-over-year growth 2021-2026 (%)
- 8.9 China – Market size and forecast 2021-2026
- Exhibit 80: Chart on China – Market size and forecast 2021-2026 ($ million)
- Exhibit 81: Data Table on China – Market size and forecast 2021-2026 ($ million)
- Exhibit 82: Chart on China – Year-over-year growth 2021-2026 (%)
- Exhibit 83: Data Table on China – Year-over-year growth 2021-2026 (%)
- 8.10 UK – Market size and forecast 2021-2026
- Exhibit 84: Chart on UK – Market size and forecast 2021-2026 ($ million)
- Exhibit 85: Data Table on UK – Market size and forecast 2021-2026 ($ million)
- Exhibit 86: Chart on UK – Year-over-year growth 2021-2026 (%)
- Exhibit 87: Data Table on UK – Year-over-year growth 2021-2026 (%)
- 8.11 France – Market size and forecast 2021-2026
- Exhibit 88: Chart on France – Market size and forecast 2021-2026 ($ million)
- Exhibit 89: Data Table on France – Market size and forecast 2021-2026 ($ million)
- Exhibit 90: Chart on France – Year-over-year growth 2021-2026 (%)
- Exhibit 91: Data Table on France – Year-over-year growth 2021-2026 (%)
- 8.12 Japan – Market size and forecast 2021-2026
- Exhibit 92: Chart on Japan – Market size and forecast 2021-2026 ($ million)
- Exhibit 93: Data Table on Japan – Market size and forecast 2021-2026 ($ million)
- Exhibit 94: Chart on Japan – Year-over-year growth 2021-2026 (%)
- Exhibit 95: Data Table on Japan – Year-over-year growth 2021-2026 (%)
- 8.13 Market opportunity by geography
- Exhibit 96: Market opportunity by geography ($ million)
9 Drivers, Challenges, and Trends
- 9.1 Market drivers
- 9.2 Market challenges
- 9.3 Impact of drivers and challenges
- Exhibit 97: Impact of drivers and challenges in 2021 and 2026
- 9.4 Market trends
10 Vendor Landscape
- 10.1 Overview
- 10.2 Vendor landscape
- Exhibit 98: Overview on Criticality of inputs and Factors of differentiation
- 10.3 Landscape disruption
- Exhibit 99: Overview on factors of disruption
- 10.4 Industry risks
- Exhibit 100: Impact of key risks on business
11 Vendor Analysis
- 11.1 Vendors covered
- Exhibit 101: Vendors covered
- 11.2 Market positioning of vendors
- Exhibit 102: Matrix on vendor position and classification
- 11.3 4M Group
- Exhibit 103: 4M Group – Overview
- Exhibit 104: 4M Group – Product / Service
- Exhibit 105: 4M Group – Key offerings
- 11.4 Autodesk Inc
- Exhibit 106: Autodesk Inc – Overview
- Exhibit 107: Autodesk Inc – Product / Service
- Exhibit 108: Autodesk Inc – Key news
- Exhibit 109: Autodesk Inc – Key offerings
- 11.5 AVEVA Group Plc
- Exhibit 110: AVEVA Group Plc – Overview
- Exhibit 111: AVEVA Group Plc – Business segments
- Exhibit 112: AVEVA Group Plc – Key offerings
- Exhibit 113: AVEVA Group Plc – Segment focus
- 11.6 Bentley Systems Inc.
- Exhibit 114: Bentley Systems Inc. – Overview
- Exhibit 115: Bentley Systems Inc. – Product / Service
- Exhibit 116: Bentley Systems Inc. – Key news
- Exhibit 117: Bentley Systems Inc. – Key offerings
- 11.7 CYPE Ingenieros SA
- Exhibit 118: CYPE Ingenieros SA – Overview
- Exhibit 119: CYPE Ingenieros SA – Product / Service
- Exhibit 120: CYPE Ingenieros SA – Key offerings
- 11.8 Dassault Systemes SE
- Exhibit 121: Dassault Systemes SE – Overview
- Exhibit 122: Dassault Systemes SE – Product / Service
- Exhibit 123: Dassault Systemes SE – Key news
- Exhibit 124: Dassault Systemes SE – Key offerings
- 11.9 Hexagon AB
- Exhibit 125: Hexagon AB – Overview
- Exhibit 126: Hexagon AB – Business segments
- Exhibit 127: Hexagon AB – Key news
- Exhibit 128: Hexagon AB – Key offerings
- Exhibit 129: Hexagon AB – Segment focus
- 11.10 Innovaya LLC
- Exhibit 130: Innovaya LLC – Overview
- Exhibit 131: Innovaya LLC – Product / Service
- Exhibit 132: Innovaya LLC – Key offerings
- 11.11 Nemetschek SE
- Exhibit 133: Nemetschek SE – Overview
- Exhibit 134: Nemetschek SE – Business segments
- Exhibit 135: Nemetschek SE – Key offerings
- Exhibit 136: Nemetschek SE – Segment focus
- 11.12 Trimble Inc.
- Exhibit 137: Trimble Inc. – Overview
- Exhibit 138: Trimble Inc. – Business segments
- Exhibit 139: Trimble Inc. – Key offerings
- Exhibit 140: Trimble Inc. – Segment focus
12 Appendix
- 12.1 Scope of the report
- 12.2 Inclusions and exclusions checklist
- Exhibit 141: Inclusions checklist
- Exhibit 142: Exclusions checklist
- 12.3 Currency conversion rates for US$
- Exhibit 143: Currency conversion rates for US$
- 12.4 Research methodology
- Exhibit 144: Research methodology
- Exhibit 145: Validation techniques employed for market sizing
- Exhibit 146: Information sources
- 12.5 List of abbreviations
- Exhibit 147: List of abbreviations
Technavio is a leading global technology research and advisory company. Their research and analysis focus on emerging market trends and provides actionable insights to help businesses identify market opportunities and develop effective strategies to optimize their market positions. With over 500 specialized analysts, Technavio’s report library consists of more than 17,000 reports and counting, covering 800 technologies, spanning across 50 countries. Their client base consists of enterprises of all sizes, including more than 100 Fortune 500 companies. This growing client base relies on Technavio’s comprehensive coverage, extensive research, and actionable market insights to identify opportunities in existing and potential markets and assess their competitive positions within changing market scenarios.
Contact
Technavio Research
Jesse Maida
Media & Marketing Executive
US: +1 844 364 1100
UK: +44 203 893 3200
Email: media@technavio.com
Website: www.technavio.com/
![]()
![]() View original content to download multimedia:https://www.prnewswire.com/news-releases/architectural-engineering-and-construction-solutions-aecs-market-size-to-grow-by-usd-6-41-bn-driven-by-the-increasing-need-for-managing-large-scale-projects–technavio-301649578.html
View original content to download multimedia:https://www.prnewswire.com/news-releases/architectural-engineering-and-construction-solutions-aecs-market-size-to-grow-by-usd-6-41-bn-driven-by-the-increasing-need-for-managing-large-scale-projects–technavio-301649578.html
SOURCE Technavio
