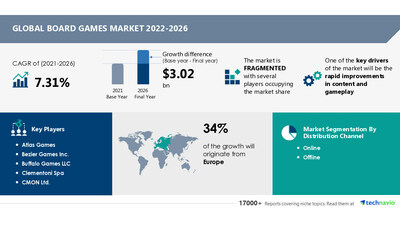
NEW YORK, Jan. 16, 2023 /PRNewswire/ — The global board games market size is estimated to increase by USD 3.02 billion from 2021 to 2026. The market’s growth momentum will accelerate at a CAGR of 7.31% during the forecast period – Request a sample report

Global board games market – Vendor analysis
Vendor offerings –
- Atlas Games – The company offers the White Box board game, which includes a selection of generic game materials for designers, including dice, meeples, and cubes, among others.
- Clementoni Spa – The company offers the Stranger Things board game, which includes character cards and place cards.
- CMON Ltd. – The company offers Mayhem board games, such as Looney Tunes and Teen Titans Go.
- Franckh-Kosmos Verlags-GmbH and Co. KG – The company offers a wider range of board games, such as Exit and Imhotep, among others.
- For details on vendors and their offerings – Buy the report!
Vendor landscape –
The global board games market is fragmented, with the presence of several vendors. A few prominent vendors that offer board games in the market are Atlas Games, Bezier Games Inc., Buffalo Games LLC, Clementoni Spa, CMON Ltd., Franckh-Kosmos Verlags-GmbH and Co. KG, Fremont Die Consumer Products Inc., Gibsons Games Ltd., Grey Fox Games, Hasbro Inc., Indie Boards and Cards, Mattel Inc., National Entertainment Collectibles Association Inc., PD Verlag GmbH and Co. KG, Ravensburger Group, Goliath Games LLC, The Walt Disney Co., Games Workshop Group PLC, Mindware Inc., and Warlord Games and others.
The key competitive criteria in the market include service delivery innovation, technology innovation, and experience of the service. Some of the other factors influencing the competition are price and product differentiation. Vendors are increasingly investing in R&D to develop innovative board game offerings.
Global board games market – Customer landscape
To help companies evaluate and develop growth strategies, the report outlines –
- Key purchase criteria
- Adoption rates
- Adoption lifecycle
- Drivers of price sensitivity
Global board games market – Segmentation assessment
Segment overview
Technavio has segmented the market based on distribution channel (online and offline) and product (tabletop, card and dice, and role-playing).
- The online segment will grow at a significant rate during the forecast period. The number of e-commerce vendors is increasing globally, with the growing penetration of smartphones. Online shopping enables consumers to gain personalized shopping assistance and get suggestions on the types of games, such as scientific games and knowledge-based. E-commerce sites also allow customers to collect product detail and description and compare various board games. Therefore, the strong penetration of Internet-enabled mobile devices such as smartphones and tablets in countries such as the US, France, and Germany is expected to drive the growth of the online sales segment during the forecast period.
Geography overview
Based on geography, the global board games market is segmented into Europe, North America, APAC, Middle East and Africa, and South America. The report provides actionable insights and estimates the contribution of all regions to the growth of the global board games market.
- Europe will account for 34% of the market’s growth during the forecast period. France, Germany, and the UK are the key revenue contributors to the market in Europe. However, market growth in this region will be slower than the growth of the market in other regions. The growing popularity of alternative gaming platforms such as mobile games and the mature stage of the market will drive the market’s growth in Europe during the forecast period.
Global board games market – Market dynamics
Leading drivers – The rapid improvements in content and gameplay are driving the market’s growth. Manufacturers are focusing on developing story-driven games to offer immersive experiences. These games enable participants to interact with each while ensuring strong engagement throughout the play. Classic board games such as Monopoly, Scrabble, Clue, and Life have undergone regular updates in illustrations and gameplay to cater to the changing market demand. In addition, licensing deals between board game developers and popular movie and TV franchises lead to the development of story arcs and character updates in board games. Thus, the rapid developments and updates in content gameplay are expected to fuel the market growth during the forecast period.
Key trends – Increasing digitization is a key trend in the market. Several board game publishers are incorporating mobile applications as part of the gaming experience. Digital games enable players to play online with friends regardless of location. Vendors are also providing mobile applications to assist in gameplay. This is expected to support market growth during the forecast period.
Major challenges – The threat from alternate gaming platforms is challenging the market’s growth. The penetration of mobile devices such as smartphones and tablets has increased, which has led to the emergence of mobile-based game offerings. These applications offer an immersive experience through extensive storyboarding and detailing. Console-based and PC-based gaming publishers offer a range of gaming titles at competitive rates. Thus, the growing threat from alternative gaming platforms is expected to hinder the growth of the market during the forecast period.
What are the key data covered in this board games market report?
- CAGR of the market during the forecast period
- Detailed information on factors that will drive the growth of the board games market between 2022 and 2026
- Precise estimation of the size of the board games market and its contribution to the parent market
- Accurate predictions about upcoming trends and changes in consumer behavior
- Growth of the board games market across Europe, North America, APAC, Middle East and Africa, and South America
- A thorough analysis of the market’s competitive landscape and detailed information about vendors
- Comprehensive analysis of factors that will challenge the growth of board games market vendors
Gain instant access to 17,000+ market research reports.
Technavio’s SUBSCRIPTION platform
Related Reports:
The toys and games market is estimated to grow at a CAGR of 8.1% between 2022 and 2027. The size of the market is forecasted to increase by USD 70.12 million. This report extensively covers market segmentation by product (activity and ride-on toys, infant and pre-school toys, games and puzzles, plush toys, and others), distribution channel (offline and online), and geography (APAC, North America, Europe, Middle East and Africa, and South America).
The online toys and games retailing market size is expected to increase by USD 16.04 billion from 2021 to 2026, and the market’s growth momentum will accelerate at a CAGR of 6.39%. This report extensively covers segmentation by product (activity and ride-on toys, infant and pre-school toys, plush toys, games and puzzles, and others) and geography (North America, APAC, Europe, South America, and the Middle East and Africa).
|
Board Games Market Scope |
|
|
Report Coverage |
Details |
|
Page number |
153 |
|
Base year |
2021 |
|
Forecast period |
2022-2026 |
|
Growth momentum & CAGR |
Accelerate at a CAGR of 7.31% |
|
Market growth 2022-2026 |
USD 3.02 billion |
|
Market structure |
Fragmented |
|
YoY growth 2021-2022 (%) |
6.52 |
|
Regional analysis |
Europe, North America, APAC, Middle East and Africa, and South America |
|
Performing market contribution |
Europe at 34% |
|
Key countries |
US, China, France, Germany, and UK |
|
Competitive landscape |
Leading vendors, market positioning of vendors, competitive strategies, and industry risks |
|
Key companies profiled |
Atlas Games, Bezier Games Inc., Buffalo Games LLC, Clementoni Spa, CMON Ltd., Franckh-Kosmos Verlags-GmbH and Co. KG, Fremont Die Consumer Products Inc., Gibsons Games Ltd., Grey Fox Games, Hasbro Inc., Indie Boards and Cards, Mattel Inc., National Entertainment Collectibles Association Inc., PD Verlag GmbH and Co. KG, Ravensburger Group, Goliath Games LLC, The Walt Disney Co., Games Workshop Group PLC, Mindware Inc., and Warlord Games |
|
Market dynamics |
Parent market analysis, market growth inducers and obstacles, fast-growing and slow-growing segment analysis, COVID-19 impact and recovery analysis and future consumer dynamics, and market condition analysis for the forecast period. |
|
Customization purview |
If our report has not included the data that you are looking for, you can reach out to our analysts and get segments customized. |
|
Customization purview |
If our report has not included the data that you are looking for, you can reach out to our analysts and get segments customized. |
Browse for Technavio’s consumer discretionary market reports
Table of contents
1 Executive Summary
- 1.1 Market overview
- Exhibit 01: Executive Summary – Chart on Market Overview
- Exhibit 02: Executive Summary – Data Table on Market Overview
- Exhibit 03: Executive Summary – Chart on Global Market Characteristics
- Exhibit 04: Executive Summary – Chart on Market by Geography
- Exhibit 05: Executive Summary – Chart on Market Segmentation by Distribution Channel
- Exhibit 06: Executive Summary – Chart on Market Segmentation by Product
- Exhibit 07: Executive Summary – Chart on Incremental Growth
- Exhibit 08: Executive Summary – Data Table on Incremental Growth
- Exhibit 09: Executive Summary – Chart on Vendor Market Positioning
2 Market Landscape
- 2.1 Market ecosystem
- Exhibit 10: Parent market
- Exhibit 11: Market Characteristics
3 Market Sizing
- 3.1 Market definition
- Exhibit 12: Offerings of vendors included in the market definition
- 3.2 Market segment analysis
- Exhibit 13: Market segments
- 3.3 Market size 2021
- 3.4 Market outlook: Forecast for 2021-2026
- Exhibit 14: Chart on Global – Market size and forecast 2021-2026 ($ million)
- Exhibit 15: Data Table on Global – Market size and forecast 2021-2026 ($ million)
- Exhibit 16: Chart on Global Market: Year-over-year growth 2021-2026 (%)
- Exhibit 17: Data Table on Global Market: Year-over-year growth 2021-2026 (%)
4 Five Forces Analysis
- 4.1 Five forces summary
- Exhibit 18: Five forces analysis – Comparison between 2021 and 2026
- 4.2 Bargaining power of buyers
- Exhibit 19: Chart on Bargaining power of buyers – Impact of key factors 2021 and 2026
- 4.3 Bargaining power of suppliers
- Exhibit 20: Bargaining power of suppliers – Impact of key factors in 2021 and 2026
- 4.4 Threat of new entrants
- Exhibit 21: Threat of new entrants – Impact of key factors in 2021 and 2026
- 4.5 Threat of substitutes
- Exhibit 22: Threat of substitutes – Impact of key factors in 2021 and 2026
- 4.6 Threat of rivalry
- Exhibit 23: Threat of rivalry – Impact of key factors in 2021 and 2026
- 4.7 Market condition
- Exhibit 24: Chart on Market condition – Five forces 2021 and 2026
5 Market Segmentation by Distribution Channel
- 5.1 Market segments
- Exhibit 25: Chart on Distribution Channel – Market share 2021-2026 (%)
- Exhibit 26: Data Table on Distribution Channel – Market share 2021-2026 (%)
- 5.2 Comparison by Distribution Channel
- Exhibit 27: Chart on Comparison by Distribution Channel
- Exhibit 28: Data Table on Comparison by Distribution Channel
- 5.3 Online – Market size and forecast 2021-2026
- Exhibit 29: Chart on Online – Market size and forecast 2021-2026 ($ million)
- Exhibit 30: Data Table on Online – Market size and forecast 2021-2026 ($ million)
- Exhibit 31: Chart on Online – Year-over-year growth 2021-2026 (%)
- Exhibit 32: Data Table on Online – Year-over-year growth 2021-2026 (%)
- 5.4 Offline – Market size and forecast 2021-2026
- Exhibit 33: Chart on Offline – Market size and forecast 2021-2026 ($ million)
- Exhibit 34: Data Table on Offline – Market size and forecast 2021-2026 ($ million)
- Exhibit 35: Chart on Offline – Year-over-year growth 2021-2026 (%)
- Exhibit 36: Data Table on Offline – Year-over-year growth 2021-2026 (%)
- 5.5 Market opportunity by Distribution Channel
- Exhibit 37: Market opportunity by Distribution Channel ($ million)
6 Market Segmentation by Product
- 6.1 Market segments
- Exhibit 38: Chart on Product – Market share 2021-2026 (%)
- Exhibit 39: Data Table on Product – Market share 2021-2026 (%)
- 6.2 Comparison by Product
- Exhibit 40: Chart on Comparison by Product
- Exhibit 41: Data Table on Comparison by Product
- 6.3 Tabletop – Market size and forecast 2021-2026
- Exhibit 42: Chart on Tabletop – Market size and forecast 2021-2026 ($ million)
- Exhibit 43: Data Table on Tabletop – Market size and forecast 2021-2026 ($ million)
- Exhibit 44: Chart on Tabletop – Year-over-year growth 2021-2026 (%)
- Exhibit 45: Data Table on Tabletop – Year-over-year growth 2021-2026 (%)
- 6.4 Card and dice – Market size and forecast 2021-2026
- Exhibit 46: Chart on Card and dice – Market size and forecast 2021-2026 ($ million)
- Exhibit 47: Data Table on Card and dice – Market size and forecast 2021-2026 ($ million)
- Exhibit 48: Chart on Card and dice – Year-over-year growth 2021-2026 (%)
- Exhibit 49: Data Table on Card and dice – Year-over-year growth 2021-2026 (%)
- 6.5 Role-playing – Market size and forecast 2021-2026
- Exhibit 50: Chart on Role-playing – Market size and forecast 2021-2026 ($ million)
- Exhibit 51: Data Table on Role-playing – Market size and forecast 2021-2026 ($ million)
- Exhibit 52: Chart on Role-playing – Year-over-year growth 2021-2026 (%)
- Exhibit 53: Data Table on Role-playing – Year-over-year growth 2021-2026 (%)
- 6.6 Market opportunity by Product
- Exhibit 54: Market opportunity by Product ($ million)
7 Customer Landscape
- 7.1 Customer landscape overview
- Exhibit 55: Analysis of price sensitivity, lifecycle, customer purchase basket, adoption rates, and purchase criteria
8 Geographic Landscape
- 8.1 Geographic segmentation
- Exhibit 56: Chart on Market share by geography 2021-2026 (%)
- Exhibit 57: Data Table on Market share by geography 2021-2026 (%)
- 8.2 Geographic comparison
- Exhibit 58: Chart on Geographic comparison
- Exhibit 59: Data Table on Geographic comparison
- 8.3 Europe – Market size and forecast 2021-2026
- Exhibit 60: Chart on Europe – Market size and forecast 2021-2026 ($ million)
- Exhibit 61: Data Table on Europe – Market size and forecast 2021-2026 ($ million)
- Exhibit 62: Chart on Europe – Year-over-year growth 2021-2026 (%)
- Exhibit 63: Data Table on Europe – Year-over-year growth 2021-2026 (%)
- 8.4 North America – Market size and forecast 2021-2026
- Exhibit 64: Chart on North America – Market size and forecast 2021-2026 ($ million)
- Exhibit 65: Data Table on North America – Market size and forecast 2021-2026 ($ million)
- Exhibit 66: Chart on North America – Year-over-year growth 2021-2026 (%)
- Exhibit 67: Data Table on North America – Year-over-year growth 2021-2026 (%)
- 8.5 APAC – Market size and forecast 2021-2026
- Exhibit 68: Chart on APAC – Market size and forecast 2021-2026 ($ million)
- Exhibit 69: Data Table on APAC – Market size and forecast 2021-2026 ($ million)
- Exhibit 70: Chart on APAC – Year-over-year growth 2021-2026 (%)
- Exhibit 71: Data Table on APAC – Year-over-year growth 2021-2026 (%)
- 8.6 Middle East and Africa – Market size and forecast 2021-2026
- Exhibit 72: Chart on Middle East and Africa – Market size and forecast 2021-2026 ($ million)
- Exhibit 73: Data Table on Middle East and Africa – Market size and forecast 2021-2026 ($ million)
- Exhibit 74: Chart on Middle East and Africa – Year-over-year growth 2021-2026 (%)
- Exhibit 75: Data Table on Middle East and Africa – Year-over-year growth 2021-2026 (%)
- 8.7 South America – Market size and forecast 2021-2026
- Exhibit 76: Chart on South America – Market size and forecast 2021-2026 ($ million)
- Exhibit 77: Data Table on South America – Market size and forecast 2021-2026 ($ million)
- Exhibit 78: Chart on South America – Year-over-year growth 2021-2026 (%)
- Exhibit 79: Data Table on South America – Year-over-year growth 2021-2026 (%)
- 8.8 US – Market size and forecast 2021-2026
- Exhibit 80: Chart on US – Market size and forecast 2021-2026 ($ million)
- Exhibit 81: Data Table on US – Market size and forecast 2021-2026 ($ million)
- Exhibit 82: Chart on US – Year-over-year growth 2021-2026 (%)
- Exhibit 83: Data Table on US – Year-over-year growth 2021-2026 (%)
- 8.9 France – Market size and forecast 2021-2026
- Exhibit 84: Chart on France – Market size and forecast 2021-2026 ($ million)
- Exhibit 85: Data Table on France – Market size and forecast 2021-2026 ($ million)
- Exhibit 86: Chart on France – Year-over-year growth 2021-2026 (%)
- Exhibit 87: Data Table on France – Year-over-year growth 2021-2026 (%)
- 8.10 Germany – Market size and forecast 2021-2026
- Exhibit 88: Chart on Germany – Market size and forecast 2021-2026 ($ million)
- Exhibit 89: Data Table on Germany – Market size and forecast 2021-2026 ($ million)
- Exhibit 90: Chart on Germany – Year-over-year growth 2021-2026 (%)
- Exhibit 91: Data Table on Germany – Year-over-year growth 2021-2026 (%)
- 8.11 UK – Market size and forecast 2021-2026
- Exhibit 92: Chart on UK – Market size and forecast 2021-2026 ($ million)
- Exhibit 93: Data Table on UK – Market size and forecast 2021-2026 ($ million)
- Exhibit 94: Chart on UK – Year-over-year growth 2021-2026 (%)
- Exhibit 95: Data Table on UK – Year-over-year growth 2021-2026 (%)
- 8.12 China – Market size and forecast 2021-2026
- Exhibit 96: Chart on China – Market size and forecast 2021-2026 ($ million)
- Exhibit 97: Data Table on China – Market size and forecast 2021-2026 ($ million)
- Exhibit 98: Chart on China – Year-over-year growth 2021-2026 (%)
- Exhibit 99: Data Table on China – Year-over-year growth 2021-2026 (%)
- 8.13 Market opportunity by geography
- Exhibit 100: Market opportunity by geography ($ million)
9 Drivers, Challenges, and Trends
- 9.1 Market drivers
- 9.2 Market challenges
- 9.3 Impact of drivers and challenges
- Exhibit 101: Impact of drivers and challenges in 2021 and 2026
- 9.4 Market trends
10 Vendor Landscape
- 10.1 Overview
- 10.2 Vendor landscape
- Exhibit 102: Overview on Criticality of inputs and Factors of differentiation
- 10.3 Landscape disruption
- Exhibit 103: Overview on factors of disruption
- 10.4 Industry risks
- Exhibit 104: Impact of key risks on business
11 Vendor Analysis
- 11.1 Vendors covered
- Exhibit 105: Vendors covered
- 11.2 Market positioning of vendors
- Exhibit 106: Matrix on vendor position and classification
- 11.3 Atlas Games
- Exhibit 107: Atlas Games – Overview
- Exhibit 108: Atlas Games – Product / Service
- Exhibit 109: Atlas Games – Key offerings
- 11.4 Clementoni Spa
- Exhibit 110: Clementoni Spa – Overview
- Exhibit 111: Clementoni Spa – Product / Service
- Exhibit 112: Clementoni Spa – Key offerings
- 11.5 CMON Ltd.
- Exhibit 113: CMON Ltd. – Overview
- Exhibit 114: CMON Ltd. – Product / Service
- Exhibit 115: CMON Ltd. – Key news
- Exhibit 116: CMON Ltd. – Key offerings
- 11.6 Franckh-Kosmos Verlags-GmbH and Co. KG
- Exhibit 117: Franckh-Kosmos Verlags-GmbH and Co. KG – Overview
- Exhibit 118: Franckh-Kosmos Verlags-GmbH and Co. KG – Product / Service
- Exhibit 119: Franckh-Kosmos Verlags-GmbH and Co. KG – Key offerings
- 11.7 Gibsons Games Ltd.
- Exhibit 120: Gibsons Games Ltd. – Overview
- Exhibit 121: Gibsons Games Ltd. – Product / Service
- Exhibit 122: Gibsons Games Ltd. – Key offerings
- 11.8 Goliath Games LLC
- Exhibit 123: Goliath Games LLC – Overview
- Exhibit 124: Goliath Games LLC – Product / Service
- Exhibit 125: Goliath Games LLC – Key offerings
- 11.9 Hasbro Inc.
- Exhibit 126: Hasbro Inc. – Overview
- Exhibit 127: Hasbro Inc. – Business segments
- Exhibit 128: Hasbro Inc. – Key news
- Exhibit 129: Hasbro Inc. – Key offerings
- Exhibit 130: Hasbro Inc. – Segment focus
- 11.10 Mattel Inc.
- Exhibit 131: Mattel Inc. – Overview
- Exhibit 132: Mattel Inc. – Product / Service
- Exhibit 133: Mattel Inc. – Key offerings
- 11.11 PD Verlag GmbH and Co. KG
- Exhibit 134: PD Verlag GmbH and Co. KG – Overview
- Exhibit 135: PD Verlag GmbH and Co. KG – Product / Service
- Exhibit 136: PD Verlag GmbH and Co. KG – Key offerings
- 11.12 Ravensburger Group
- Exhibit 137: Ravensburger Group – Overview
- Exhibit 138: Ravensburger Group – Product / Service
- Exhibit 139: Ravensburger Group – Key news
- Exhibit 140: Ravensburger Group – Key offerings
12 Appendix
- 12.1 Scope of the report
- 12.2 Inclusions and exclusions checklist
- Exhibit 141: Inclusions checklist
- Exhibit 142: Exclusions checklist
- 12.3 Currency conversion rates for US$
- Exhibit 143: Currency conversion rates for US$
- 12.4 Research methodology
- Exhibit 144: Research methodology
- Exhibit 145: Validation techniques employed for market sizing
- Exhibit 146: Information sources
- 12.5 List of abbreviations
- Exhibit 147: List of abbreviations
About Us
Technavio is a leading global technology research and advisory company. Their research and analysis focus on emerging market trends and provide actionable insights to help businesses identify market opportunities and develop effective strategies to optimize their market positions. With over 500 specialized analysts, Technavio’s report library consists of more than 17,000 reports and counting, covering 800 technologies, spanning across 50 countries. Their client base consists of enterprises of all sizes, including more than 100 Fortune 500 companies. This growing client base relies on Technavio’s comprehensive coverage, extensive research, and actionable market insights to identify opportunities in existing and potential markets and assess their competitive positions within changing market scenarios.
Contact
Technavio Research
Jesse Maida
Media & Marketing Executive
US: +1 844 364 1100
UK: +44 203 893 3200
Email: media@technavio.com
Website: www.technavio.com/
![]()
![]() View original content to download multimedia:https://www.prnewswire.com/news-releases/board-games-market-size-to-grow-by-usd-3-02-billion-from-2021-to-2026-a-descriptive-analysis-of-customer-landscape-vendor-assessment-and-market-dynamics—technavio-301719086.html
View original content to download multimedia:https://www.prnewswire.com/news-releases/board-games-market-size-to-grow-by-usd-3-02-billion-from-2021-to-2026-a-descriptive-analysis-of-customer-landscape-vendor-assessment-and-market-dynamics—technavio-301719086.html
SOURCE Technavio
