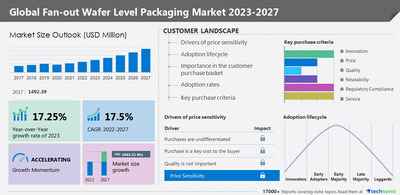
NEW YORK, May 19, 2023 /PRNewswire/ — The fan-out wafer level packaging market size is set to grow by USD 3064.31 million from 2022 to 2027 progressing at a CAGR of 17.5% during the forecast period. The report offers an up-to-date analysis regarding the current global market scenario, the latest trends and drivers, and the overall market environment. The market is driven by increased demand for compactly designed electronics. Here is an Exclusive report talking about Market scenarios with a historical period (2017-2021) and the forecast period (2023-2027). Download Sample Report in minutes!

The report on the fan-out wafer-level packaging market provides a holistic update, market size and forecast, trends, growth drivers, and challenges, as well as vendor analysis.
Fan-out Wafer Level Packaging Market 2023-2027 – Market Dynamics
Market Driver
- Increased demand for compactly designed electronics
- Growing use of semiconductor ICs in IoT
- Rapid adoption of FinFET technology
Market Trend
- Increasing adoption of semiconductor ICs in automobiles
- Rising panel-level packaging
- Incorporation of more functionalities in smartphones
Market Challenges
- Increased production costs because of warpage
- Cyclical nature of the semiconductor industry
- Highly complex design of ICs
Fan-out Wafer Level Packaging Market 2023-2027: Market Segmentation
The fan-out wafer level packaging market is segmented by technology (high density and standard density), type (200 mm, 300 mm, and panel), and geography (APAC, North America, Europe, South America, and Middle East and Africa.
The market share growth by the high-density segment will be significant during the forecast period. The market has witnessed a growth momentum owing to the increased investments in the development of high-density FOWLP. APAC is estimated to contribute 77% to the growth of the global market during the forecast period. The increasing government initiatives for the expansion of the semiconductor packaging industry in APAC countries will increase the growth of the market.
The report comprises various segments as well as an analysis of the trends and factors that are playing a substantial role in the market. View Sample Report
The fan-out wafer-level packaging market covers the following areas:
Fan-out Wafer Level Packaging Market Sizing
Fan-out Wafer Level Packaging Market Forecast
Fan-out Wafer Level Packaging Market Analysis
Companies Mentioned
- Amkor Technology Inc.
- ASE Technology Holding Co. Ltd.
- Deca Technologies Inc.
- Jiangsu Changdian Technology Co. Ltd.
- nepes Corp.
- Nordson Corp.
- NXP Semiconductors NV
- Onto Innovation Inc.
- Panasonic Holdings Corp.
- Powertech Technology Inc.
- Renesas Electronics Corp.
- Singapore Semiconductor Industry Association
- SUSS MICROTEC SE
- Taiwan Semiconductor Manufacturing Co. Ltd.
- Unisem M Berhad
- UTAC Holdings Ltd.
- Winbond Electronics Corp.
- Yield Engineering Systems
- Yole Group
- Infineon Technologies AG
amkor.com- The company offers fan out wafer level packaging schemes for System in Package or SIP and chip scale to 3D systems.
aseglobal.com- The company offers fan out wafer level packaging with fan out package on package or FOPoP with density interconnection fan out multi chip modules under its subsidiary called Siliconware Precision Industries Co. Ltd.
thinkdeca.com- The company offers Fan out Wafer Level Packaging for M series semi conductor industries.
Related Reports:
Smart Railway Systems Market – The smart railway systems market size is estimated to grow at a CAGR of 12.59% between 2022 and 2027. The smart railway systems market size is forecast to increase by USD 20,129.36 million.
Network Interface Cards Market– The network interface cards market size is estimated to grow at a CAGR of 4.84% between 2022 and 2027. The network interface cards market size is forecast to increase by USD 2,903.19 million.
Register for a free trial today and gain instant access to 17,000+ market research reports.
Technavio’s SUBSCRIPTION platform
|
Fan-out Wafer Level Packaging Market Scope |
|
|
Report Coverage |
Details |
|
Base year |
2022 |
|
Historic period |
2017-2021 |
|
Forecast period |
2023-2027 |
|
Growth momentum & CAGR |
Accelerate at a CAGR of 17.5% |
|
Market growth 2023-2027 |
USD 3064.31 million |
|
Market structure |
Fragmented |
|
YoY growth 2022-2023(%) |
17.25 |
|
Regional analysis |
APAC, North America, Europe, South America, and Middle East and Africa |
|
Performing market contribution |
APAC at 77% |
|
Key countries |
US, Taiwan, South Korea, China, and Japan |
|
Competitive landscape |
Leading Vendors, Market Positioning of Vendors, Competitive Strategies, and Industry Risks |
|
Key companies profiled |
Amkor Technology Inc., ASE Technology Holding Co. Ltd., Deca Technologies Inc., Jiangsu Changdian Technology Co. Ltd., nepes Corp., Nordson Corp., NXP Semiconductors NV, Onto Innovation Inc., Panasonic Holdings Corp., Powertech Technology Inc., Renesas Electronics Corp., Singapore Semiconductor Industry Association, SUSS MICROTEC SE, Taiwan Semiconductor Manufacturing Co. Ltd., Unisem M Berhad, UTAC Holdings Ltd., Winbond Electronics Corp., Yield Engineering Systems, Yole Group, and Infineon Technologies AG |
|
Market dynamics |
Parent market analysis, Market growth inducers and obstacles, Fast-growing and slow-growing segment analysis, COVID-19 impact and recovery analysis and future consumer dynamics, Market condition analysis for forecast period |
|
Customization purview |
If our report has not included the data that you are looking for, you can reach out to our analysts and get segments customized. |
Key Topics Covered:
1 Executive Summary
- 1.1 Market overview
- Exhibit 01: Executive Summary – Chart on Market Overview
- Exhibit 02: Executive Summary – Data Table on Market Overview
- Exhibit 03: Executive Summary – Chart on Global Market Characteristics
- Exhibit 04: Executive Summary – Chart on Market by Geography
- Exhibit 05: Executive Summary – Chart on Market Segmentation by Technology
- Exhibit 06: Executive Summary – Chart on Market Segmentation by Type
- Exhibit 07: Executive Summary – Chart on Incremental Growth
- Exhibit 08: Executive Summary – Data Table on Incremental Growth
- Exhibit 09: Executive Summary – Chart on Vendor Market Positioning
2 Market Landscape
- 2.1 Market ecosystem
- Exhibit 10: Parent market
- Exhibit 11: Market Characteristics
3 Market Sizing
- 3.1 Market definition
- Exhibit 12: Offerings of vendors included in the market definition
- 3.2 Market segment analysis
- Exhibit 13: Market segments
- 3.3 Market size 2022
- 3.4 Market outlook: Forecast for 2022-2027
- Exhibit 14: Chart on Global – Market size and forecast 2022-2027 ($ million)
- Exhibit 15: Data Table on Global – Market size and forecast 2022-2027 ($ million)
- Exhibit 16: Chart on Global Market: Year-over-year growth 2022-2027 (%)
- Exhibit 17: Data Table on Global Market: Year-over-year growth 2022-2027 (%)
4 Historic Market Size
- 4.1 Global fan-out wafer level packaging market 2017 – 2021
- Exhibit 18: Historic Market Size – Data Table on Global fan-out wafer level packaging market 2017 – 2021 ($ million)
- 4.2 Technology Segment Analysis 2017 – 2021
- Exhibit 19: Historic Market Size – Technology Segment 2017 – 2021 ($ million)
- 4.3 Type Segment Analysis 2017 – 2021
- Exhibit 20: Historic Market Size – Type Segment 2017 – 2021 ($ million)
- 4.4 Geography Segment Analysis 2017 – 2021
- Exhibit 21: Historic Market Size – Geography Segment 2017 – 2021 ($ million)
- 4.5 Country Segment Analysis 2017 – 2021
- Exhibit 22: Historic Market Size – Country Segment 2017 – 2021 ($ million)
5 Five Forces Analysis
- 5.1 Five forces summary
- Exhibit 23: Five forces analysis – Comparison between 2022 and 2027
- 5.2 Bargaining power of buyers
- Exhibit 24: Chart on Bargaining power of buyers – Impact of key factors 2022 and 2027
- 5.3 Bargaining power of suppliers
- Exhibit 25: Bargaining power of suppliers – Impact of key factors in 2022 and 2027
- 5.4 Threat of new entrants
- Exhibit 26: Threat of new entrants – Impact of key factors in 2022 and 2027
- 5.5 Threat of substitutes
- Exhibit 27: Threat of substitutes – Impact of key factors in 2022 and 2027
- 5.6 Threat of rivalry
- Exhibit 28: Threat of rivalry – Impact of key factors in 2022 and 2027
- 5.7 Market condition
- Exhibit 29: Chart on Market condition – Five forces 2022 and 2027
6 Market Segmentation by Technology
- 6.1 Market segments
- Exhibit 30: Chart on Technology – Market share 2022-2027 (%)
- Exhibit 31: Data Table on Technology – Market share 2022-2027 (%)
- 6.2 Comparison by Technology
- Exhibit 32: Chart on Comparison by Technology
- Exhibit 33: Data Table on Comparison by Technology
- 6.3 High density – Market size and forecast 2022-2027
- Exhibit 34: Chart on High density – Market size and forecast 2022-2027 ($ million)
- Exhibit 35: Data Table on High density – Market size and forecast 2022-2027 ($ million)
- Exhibit 36: Chart on High density – Year-over-year growth 2022-2027 (%)
- Exhibit 37: Data Table on High density – Year-over-year growth 2022-2027 (%)
- 6.4 Standard density – Market size and forecast 2022-2027
- Exhibit 38: Chart on Standard density – Market size and forecast 2022-2027 ($ million)
- Exhibit 39: Data Table on Standard density – Market size and forecast 2022-2027 ($ million)
- Exhibit 40: Chart on Standard density – Year-over-year growth 2022-2027 (%)
- Exhibit 41: Data Table on Standard density – Year-over-year growth 2022-2027 (%)
- 6.5 Market opportunity by Technology
- Exhibit 42: Market opportunity by Technology ($ million)
7 Market Segmentation by Type
- 7.1 Market segments
- Exhibit 43: Chart on Type – Market share 2022-2027 (%)
- Exhibit 44: Data Table on Type – Market share 2022-2027 (%)
- 7.2 Comparison by Type
- Exhibit 45: Chart on Comparison by Type
- Exhibit 46: Data Table on Comparison by Type
- 7.3 200 mm – Market size and forecast 2022-2027
- Exhibit 47: Chart on 200 mm – Market size and forecast 2022-2027 ($ million)
- Exhibit 48: Data Table on 200 mm – Market size and forecast 2022-2027 ($ million)
- Exhibit 49: Chart on 200 mm – Year-over-year growth 2022-2027 (%)
- Exhibit 50: Data Table on 200 mm – Year-over-year growth 2022-2027 (%)
- 7.4 300 mm – Market size and forecast 2022-2027
- Exhibit 51: Chart on 300 mm – Market size and forecast 2022-2027 ($ million)
- Exhibit 52: Data Table on 300 mm – Market size and forecast 2022-2027 ($ million)
- Exhibit 53: Chart on 300 mm – Year-over-year growth 2022-2027 (%)
- Exhibit 54: Data Table on 300 mm – Year-over-year growth 2022-2027 (%)
- 7.5 Panel – Market size and forecast 2022-2027
- Exhibit 55: Chart on Panel – Market size and forecast 2022-2027 ($ million)
- Exhibit 56: Data Table on Panel – Market size and forecast 2022-2027 ($ million)
- Exhibit 57: Chart on Panel – Year-over-year growth 2022-2027 (%)
- Exhibit 58: Data Table on Panel – Year-over-year growth 2022-2027 (%)
- 7.6 Market opportunity by Type
- Exhibit 59: Market opportunity by Type ($ million)
8 Customer Landscape
- 8.1 Customer landscape overview
- Exhibit 60: Analysis of price sensitivity, lifecycle, customer purchase basket, adoption rates, and purchase criteria
9 Geographic Landscape
- 9.1 Geographic segmentation
- Exhibit 61: Chart on Market share by geography 2022-2027 (%)
- Exhibit 62: Data Table on Market share by geography 2022-2027 (%)
- 9.2 Geographic comparison
- Exhibit 63: Chart on Geographic comparison
- Exhibit 64: Data Table on Geographic comparison
- 9.3 APAC – Market size and forecast 2022-2027
- Exhibit 65: Chart on APAC – Market size and forecast 2022-2027 ($ million)
- Exhibit 66: Data Table on APAC – Market size and forecast 2022-2027 ($ million)
- Exhibit 67: Chart on APAC – Year-over-year growth 2022-2027 (%)
- Exhibit 68: Data Table on APAC – Year-over-year growth 2022-2027 (%)
- 9.4 North America – Market size and forecast 2022-2027
- Exhibit 69: Chart on North America – Market size and forecast 2022-2027 ($ million)
- Exhibit 70: Data Table on North America – Market size and forecast 2022-2027 ($ million)
- Exhibit 71: Chart on North America – Year-over-year growth 2022-2027 (%)
- Exhibit 72: Data Table on North America – Year-over-year growth 2022-2027 (%)
- 9.5 Europe – Market size and forecast 2022-2027
- Exhibit 73: Chart on Europe – Market size and forecast 2022-2027 ($ million)
- Exhibit 74: Data Table on Europe – Market size and forecast 2022-2027 ($ million)
- Exhibit 75: Chart on Europe – Year-over-year growth 2022-2027 (%)
- Exhibit 76: Data Table on Europe – Year-over-year growth 2022-2027 (%)
- 9.6 South America – Market size and forecast 2022-2027
- Exhibit 77: Chart on South America – Market size and forecast 2022-2027 ($ million)
- Exhibit 78: Data Table on South America – Market size and forecast 2022-2027 ($ million)
- Exhibit 79: Chart on South America – Year-over-year growth 2022-2027 (%)
- Exhibit 80: Data Table on South America – Year-over-year growth 2022-2027 (%)
- 9.7 Middle East and Africa – Market size and forecast 2022-2027
- Exhibit 81: Chart on Middle East and Africa – Market size and forecast 2022-2027 ($ million)
- Exhibit 82: Data Table on Middle East and Africa – Market size and forecast 2022-2027 ($ million)
- Exhibit 83: Chart on Middle East and Africa – Year-over-year growth 2022-2027 (%)
- Exhibit 84: Data Table on Middle East and Africa – Year-over-year growth 2022-2027 (%)
- 9.8 Taiwan – Market size and forecast 2022-2027
- Exhibit 85: Chart on Taiwan – Market size and forecast 2022-2027 ($ million)
- Exhibit 86: Data Table on Taiwan – Market size and forecast 2022-2027 ($ million)
- Exhibit 87: Chart on Taiwan – Year-over-year growth 2022-2027 (%)
- Exhibit 88: Data Table on Taiwan – Year-over-year growth 2022-2027 (%)
- 9.9 South Korea – Market size and forecast 2022-2027
- Exhibit 89: Chart on South Korea – Market size and forecast 2022-2027 ($ million)
- Exhibit 90: Data Table on South Korea – Market size and forecast 2022-2027 ($ million)
- Exhibit 91: Chart on South Korea – Year-over-year growth 2022-2027 (%)
- Exhibit 92: Data Table on South Korea – Year-over-year growth 2022-2027 (%)
- 9.10 China – Market size and forecast 2022-2027
- Exhibit 93: Chart on China – Market size and forecast 2022-2027 ($ million)
- Exhibit 94: Data Table on China – Market size and forecast 2022-2027 ($ million)
- Exhibit 95: Chart on China – Year-over-year growth 2022-2027 (%)
- Exhibit 96: Data Table on China – Year-over-year growth 2022-2027 (%)
- 9.11 Japan – Market size and forecast 2022-2027
- Exhibit 97: Chart on Japan – Market size and forecast 2022-2027 ($ million)
- Exhibit 98: Data Table on Japan – Market size and forecast 2022-2027 ($ million)
- Exhibit 99: Chart on Japan – Year-over-year growth 2022-2027 (%)
- Exhibit 100: Data Table on Japan – Year-over-year growth 2022-2027 (%)
- 9.12 US – Market size and forecast 2022-2027
- Exhibit 101: Chart on US – Market size and forecast 2022-2027 ($ million)
- Exhibit 102: Data Table on US – Market size and forecast 2022-2027 ($ million)
- Exhibit 103: Chart on US – Year-over-year growth 2022-2027 (%)
- Exhibit 104: Data Table on US – Year-over-year growth 2022-2027 (%)
- 9.13 Market opportunity by geography
- Exhibit 105: Market opportunity by geography ($ million)
10 Drivers, Challenges, and Trends
- 10.1 Market drivers
- 10.2 Market challenges
- 10.3 Impact of drivers and challenges
- Exhibit 106: Impact of drivers and challenges in 2022 and 2027
- 10.4 Market trends
11 Vendor Landscape
- 11.1 Overview
- 11.2 Vendor landscape
- Exhibit 107: Overview on Criticality of inputs and Factors of differentiation
- 11.3 Landscape disruption
- Exhibit 108: Overview on factors of disruption
- 11.4 Industry risks
- Exhibit 109: Impact of key risks on business
12 Vendor Analysis
- 12.1 Vendors covered
- Exhibit 110: Vendors covered
- 12.2 Market positioning of vendors
- Exhibit 111: Matrix on vendor position and classification
- 12.3 Amkor Technology Inc.
- Exhibit 112: Amkor Technology Inc. – Overview
- Exhibit 113: Amkor Technology Inc. – Business segments
- Exhibit 114: Amkor Technology Inc. – Key offerings
- Exhibit 115: Amkor Technology Inc. – Segment focus
- 12.4 ASE Technology Holding Co. Ltd.
- Exhibit 116: ASE Technology Holding Co. Ltd. – Overview
- Exhibit 117: ASE Technology Holding Co. Ltd. – Business segments
- Exhibit 118: ASE Technology Holding Co. Ltd. – Key offerings
- Exhibit 119: ASE Technology Holding Co. Ltd. – Segment focus
- 12.5 Deca Technologies Inc.
- Exhibit 120: Deca Technologies Inc. – Overview
- Exhibit 121: Deca Technologies Inc. – Product / Service
- Exhibit 122: Deca Technologies Inc. – Key offerings
- 12.6 Infineon Technologies AG
- Exhibit 123: Infineon Technologies AG – Overview
- Exhibit 124: Infineon Technologies AG – Business segments
- Exhibit 125: Infineon Technologies AG – Key news
- Exhibit 126: Infineon Technologies AG – Key offerings
- Exhibit 127: Infineon Technologies AG – Segment focus
- 12.7 Jiangsu Changdian Technology Co. Ltd.
- Exhibit 128: Jiangsu Changdian Technology Co. Ltd. – Overview
- Exhibit 129: Jiangsu Changdian Technology Co. Ltd. – Product / Service
- Exhibit 130: Jiangsu Changdian Technology Co. Ltd. – Key offerings
- 12.8 Nordson Corp.
- Exhibit 131: Nordson Corp. – Overview
- Exhibit 132: Nordson Corp. – Business segments
- Exhibit 133: Nordson Corp. – Key news
- Exhibit 134: Nordson Corp. – Key offerings
- Exhibit 135: Nordson Corp. – Segment focus
- 12.9 NXP Semiconductors NV
- Exhibit 136: NXP Semiconductors NV – Overview
- Exhibit 137: NXP Semiconductors NV – Product / Service
- Exhibit 138: NXP Semiconductors NV – Key news
- Exhibit 139: NXP Semiconductors NV – Key offerings
- 12.10 Renesas Electronics Corp.
- Exhibit 140: Renesas Electronics Corp. – Overview
- Exhibit 141: Renesas Electronics Corp. – Business segments
- Exhibit 142: Renesas Electronics Corp. – Key offerings
- Exhibit 143: Renesas Electronics Corp. – Segment focus
- 12.11 Singapore Semiconductor Industry Association
- Exhibit 144: Singapore Semiconductor Industry Association – Overview
- Exhibit 145: Singapore Semiconductor Industry Association – Product / Service
- Exhibit 146: Singapore Semiconductor Industry Association – Key offerings
- 12.12 SUSS MICROTEC SE
- Exhibit 147: SUSS MICROTEC SE – Overview
- Exhibit 148: SUSS MICROTEC SE – Business segments
- Exhibit 149: SUSS MICROTEC SE – Key news
- Exhibit 150: SUSS MICROTEC SE – Key offerings
- Exhibit 151: SUSS MICROTEC SE – Segment focus
- 12.13 Taiwan Semiconductor Manufacturing Co. Ltd.
- Exhibit 152: Taiwan Semiconductor Manufacturing Co. Ltd. – Overview
- Exhibit 153: Taiwan Semiconductor Manufacturing Co. Ltd. – Product / Service
- Exhibit 154: Taiwan Semiconductor Manufacturing Co. Ltd. – Key offerings
- 12.14 Unisem M Berhad
- Exhibit 155: Unisem M Berhad – Overview
- Exhibit 156: Unisem M Berhad – Product / Service
- Exhibit 157: Unisem M Berhad – Key offerings
- 12.15 Winbond Electronics Corp.
- Exhibit 158: Winbond Electronics Corp. – Overview
- Exhibit 159: Winbond Electronics Corp. – Business segments
- Exhibit 160: Winbond Electronics Corp. – Key offerings
- Exhibit 161: Winbond Electronics Corp. – Segment focus
- 12.16 Yield Engineering Systems
- Exhibit 162: Yield Engineering Systems – Overview
- Exhibit 163: Yield Engineering Systems – Product / Service
- Exhibit 164: Yield Engineering Systems – Key offerings
- 12.17 Yole Group
- Exhibit 165: Yole Group – Overview
- Exhibit 166: Yole Group – Product / Service
- Exhibit 167: Yole Group – Key offerings
13 Appendix
- 13.1 Scope of the report
- 13.2 Inclusions and exclusions checklist
- Exhibit 168: Inclusions checklist
- Exhibit 169: Exclusions checklist
- 13.3 Currency conversion rates for US$
- Exhibit 170: Currency conversion rates for US$
- 13.4 Research methodology
- Exhibit 171: Research methodology
- Exhibit 172: Validation techniques employed for market sizing
- Exhibit 173: Information sources
- 13.5 List of abbreviations
- Exhibit 174: List of abbreviations
About Us
Technavio is a leading global technology research and advisory company. Their research and analysis focuses on emerging market trends and provides actionable insights to help businesses identify market opportunities and develop effective strategies to optimize their market positions. With over 500 specialized analysts, Technavio’s report library consists of more than 17,000 reports and counting, covering 800 technologies, spanning across 50 countries. Their client base consists of enterprises of all sizes, including more than 100 Fortune 500 companies. This growing client base relies on Technavio’s comprehensive coverage, extensive research, and actionable market insights to identify opportunities in existing and potential markets and assess their competitive positions within changing market scenarios.
Contact
Technavio Research
Jesse Maida
Media & Marketing Executive
US: +1 844 364 1100
UK: +44 203 893 3200
Email: media@technavio.com
Website: www.technavio.com/
![]()
![]() View original content to download multimedia:https://www.prnewswire.com/news-releases/fan-out-wafer-level-packaging-market-size-to-grow-by-usd-3-064-31-million-from-2022-to-2027-growth-driven-by-growing-use-of-semiconductor-ics-in-iot–technavio-301828934.html
View original content to download multimedia:https://www.prnewswire.com/news-releases/fan-out-wafer-level-packaging-market-size-to-grow-by-usd-3-064-31-million-from-2022-to-2027-growth-driven-by-growing-use-of-semiconductor-ics-in-iot–technavio-301828934.html
SOURCE Technavio
