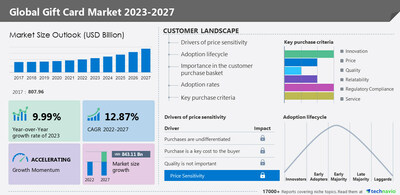
NEW YORK, May 15, 2023 /PRNewswire/ — The gift card market size is set to grow by USD 843.11 billion from 2022 to 2027. However, the growth momentum will be progressing at a CAGR of over 12.87% during the forecast period, according to Technavio. The gift card market is fragmented, and the vendors are seeking strong partnerships with automotive, industrial, and commercial companies to compete in the market. Blackhawk Network Holdings Inc., Card USA Inc, Duracard LLC, Fidelity National Information Services Inc., Fiserv Inc., FleetCor Technologies Inc., Givex Corp., Hennes and Mauritz AB, InComm, Jifiti.com Inc., Kindcard Inc., LVMH Moet Hennessy Louis Vuitton SE, PineLabs Pvt. Ltd., Plastek Card Solutions Inc., Square Inc., Tele Pak Inc, The Voucher Market Ltd., TransGate Solutions LLC, VRG Holdco Pty Ltd, and Yiftee Inc are some of the major market participants -. To know about the vendor offerings – Request a sample report

Gift Card Market 2023-2027: Scope
Technavio presents a detailed picture of the market by the way of study, synthesis, and summation of data from multiple sources. The gift card market report covers the following areas:
- Gift Card Market Size
- Gift Card Market Trends
- Gift Card Market Industry Analysis
- Porter’s Five Forces Analysis
- Customer Landscape
The gift card market is fragmented, and the degree of fragmentation will accelerate. The growth of the e-commerce sector will offer immense growth opportunities. However, the Gift cards may result in additional loss of money will hamper the market growth
Gift Card Market 2023-2027: Market Dynamics
Market Drivers
- Growth of the e-commerce sector
- Increase in the gifting culture
- Generates favorable rate of return for vendors
Market Trends
- Rise of open-loop gift cards
- Increase in demand for recyclable bio-based plastic gift cards
- Launch of new products and Services in gift cards category
Market Challenges
- Gift cards may result in additional loss of money
- Gift cards are considered impersonal
- Growing concern related to the use of plastic
To learn more about the global trends impacting the future of market research, download a PDF sample
Gift Card Market 2023-2027: Segment Analysis
- Type
- E-gifts Cards: The gift card market share growth by the E-gifts cards segment will be significant during the forecast period. The growth in digitalization across the global retail sector has led to the development of e-gift cards.
- Physical Gift Cards
- Distribution Channel
- Offline
- Online
- Geography
- North America: North America is projected to contribute 40% by 2027. The rise in consumer retail spending, better e-commerce strategies, and relatively low inflation drive the growth of the retail sector in the region.
- Europe
- APAC
- Middle East And Africa
- South America
The competitive scenario categorizes companies based on various performance indicators. Some of the factors considered include the financial performance of companies, growth strategies, product innovations, new product launches, investments, and growth in market share, among others Buy the Report
Gift Card Market 2023-2027: Key Highlights
- CAGR of the market during the forecast period 2023-2027
- Detailed information on factors that will assist gift card market growth during the next five years
- Estimation of the gift card market size and its contribution to the parent market
- Predictions on upcoming trends and changes in consumer behavior
- The growth of the gift card market across North America, Europe, APAC, Middle East and Africa, and South America
- Analysis of the market’s competitive landscape and detailed information on vendors
- Comprehensive details of factors that will challenge the growth of gift card market vendors
Related Reports:
Online Dating Services Market- The online dating services market size is estimated to grow at a CAGR of 6.01% between 2022 and 2027. The market size is forecast to increase by USD 2,741.68 million.
Online Movie Ticketing Service Market- The online movie ticketing service market size is estimated to grow at a CAGR of 6.85% between 2022 and 2027. The market size is forecast to increase by USD 7,550.89 million.
Get Instant access to 17000+ market research report
Technavio’s Subscription Platform
|
Gift Card Market Scope |
|
|
Report Coverage |
Details |
|
Base year |
2022 |
|
Historic period |
2017-2021 |
|
Forecast period |
2023-2027 |
|
Growth momentum & CAGR |
Accelerate at a CAGR of 12.87% |
|
Market growth 2023-2027 |
USD 843.11 billion |
|
Market structure |
Fragmented |
|
YoY growth 2022-2023 (%) |
9.99 |
|
Regional analysis |
North America, Europe, APAC, Middle East and Africa, and South America |
|
Performing market contribution |
North America at 40% |
|
Key countries |
US, Australia, Japan, UK, and Germany |
|
Competitive landscape |
Leading Vendors, Market Positioning of Vendors, Competitive Strategies, and Industry Risks |
|
Key companies profiled |
Blackhawk Network Holdings Inc., Card USA Inc, Duracard LLC, Fidelity National Information Services Inc., Fiserv Inc., FleetCor Technologies Inc., Givex Corp., Hennes and Mauritz AB, InComm, Jifiti.com Inc., Kindcard Inc., LVMH Moet Hennessy Louis Vuitton SE, PineLabs Pvt. Ltd., Plastek Card Solutions Inc., Square Inc., Tele Pak Inc, The Voucher Market Ltd., TransGate Solutions LLC, VRG Holdco Pty Ltd, and Yiftee Inc |
|
Market dynamics |
Parent market analysis, Market growth inducers and obstacles, Fast-growing and slow-growing segment analysis, COVID 19 impact and recovery analysis and future consumer dynamics, Market condition analysis for forecast period |
|
Customization purview |
If our report has not included the data that you are looking for, you can reach out to our analysts and get segments customized. |
|
Customization purview |
If our report has not included the data that you are looking for, you can reach out to our analysts and get segments customized. |
1 Executive Summary
- 1.1 Market overview
- Exhibit 01: Executive Summary – Chart on Market Overview
- Exhibit 02: Executive Summary – Data Table on Market Overview
- Exhibit 03: Executive Summary – Chart on Global Market Characteristics
- Exhibit 04: Executive Summary – Chart on Market by Geography
- Exhibit 05: Executive Summary – Chart on Market Segmentation by Type
- Exhibit 06: Executive Summary – Chart on Market Segmentation by Distribution Channel
- Exhibit 07: Executive Summary – Chart on Incremental Growth
- Exhibit 08: Executive Summary – Data Table on Incremental Growth
- Exhibit 09: Executive Summary – Chart on Vendor Market Positioning
2 Market Landscape
- 2.1 Market ecosystem
- Exhibit 10: Parent market
- Exhibit 11: Market Characteristics
3 Market Sizing
- 3.1 Market definition
- Exhibit 12: Offerings of vendors included in the market definition
- 3.2 Market segment analysis
- Exhibit 13: Market segments
- 3.3 Market size 2022
- 3.4 Market outlook: Forecast for 2022-2027
- Exhibit 14: Chart on Global – Market size and forecast 2022-2027 ($ billion)
- Exhibit 15: Data Table on Global – Market size and forecast 2022-2027 ($ billion)
- Exhibit 16: Chart on Global Market: Year-over-year growth 2022-2027 (%)
- Exhibit 17: Data Table on Global Market: Year-over-year growth 2022-2027 (%)
4 Historic Market Size
- 4.1 Global gift card market 2017 – 2021
- Exhibit 18: Historic Market Size – Data Table on Global gift card market 2017 – 2021 ($ billion)
- 4.2 Type Segment Analysis 2017 – 2021
- Exhibit 19: Historic Market Size – Type Segment 2017 – 2021 ($ billion)
- 4.3 Distribution channel Segment Analysis 2017 – 2021
- Exhibit 20: Historic Market Size – Distribution channel Segment 2017 – 2021 ($ billion)
- 4.4 Geography Segment Analysis 2017 – 2021
- Exhibit 21: Historic Market Size – Geography Segment 2017 – 2021 ($ billion)
- 4.5 Country Segment Analysis 2017 – 2021
- Exhibit 22: Historic Market Size – Country Segment 2017 – 2021 ($ billion)
5 Five Forces Analysis
- 5.1 Five forces summary
- Exhibit 23: Five forces analysis – Comparison between 2022 and 2027
- 5.2 Bargaining power of buyers
- Exhibit 24: Chart on Bargaining power of buyers – Impact of key factors 2022 and 2027
- 5.3 Bargaining power of suppliers
- Exhibit 25: Bargaining power of suppliers – Impact of key factors in 2022 and 2027
- 5.4 Threat of new entrants
- Exhibit 26: Threat of new entrants – Impact of key factors in 2022 and 2027
- 5.5 Threat of substitutes
- Exhibit 27: Threat of substitutes – Impact of key factors in 2022 and 2027
- 5.6 Threat of rivalry
- Exhibit 28: Threat of rivalry – Impact of key factors in 2022 and 2027
- 5.7 Market condition
- Exhibit 29: Chart on Market condition – Five forces 2022 and 2027
6 Market Segmentation by Type
- 6.1 Market segments
- Exhibit 30: Chart on Type – Market share 2022-2027 (%)
- Exhibit 31: Data Table on Type – Market share 2022-2027 (%)
- 6.2 Comparison by Type
- Exhibit 32: Chart on Comparison by Type
- Exhibit 33: Data Table on Comparison by Type
- 6.3 E-gifts cards – Market size and forecast 2022-2027
- Exhibit 34: Chart on E-gifts cards – Market size and forecast 2022-2027 ($ billion)
- Exhibit 35: Data Table on E-gifts cards – Market size and forecast 2022-2027 ($ billion)
- Exhibit 36: Chart on E-gifts cards – Year-over-year growth 2022-2027 (%)
- Exhibit 37: Data Table on E-gifts cards – Year-over-year growth 2022-2027 (%)
- 6.4 Physical gift cards – Market size and forecast 2022-2027
- Exhibit 38: Chart on Physical gift cards – Market size and forecast 2022-2027 ($ billion)
- Exhibit 39: Data Table on Physical gift cards – Market size and forecast 2022-2027 ($ billion)
- Exhibit 40: Chart on Physical gift cards – Year-over-year growth 2022-2027 (%)
- Exhibit 41: Data Table on Physical gift cards – Year-over-year growth 2022-2027 (%)
- 6.5 Market opportunity by Type
- Exhibit 42: Market opportunity by Type ($ billion)
7 Market Segmentation by Distribution Channel
- 7.1 Market segments
- Exhibit 43: Chart on Distribution Channel – Market share 2022-2027 (%)
- Exhibit 44: Data Table on Distribution Channel – Market share 2022-2027 (%)
- 7.2 Comparison by Distribution Channel
- Exhibit 45: Chart on Comparison by Distribution Channel
- Exhibit 46: Data Table on Comparison by Distribution Channel
- 7.3 Offline – Market size and forecast 2022-2027
- Exhibit 47: Chart on Offline – Market size and forecast 2022-2027 ($ billion)
- Exhibit 48: Data Table on Offline – Market size and forecast 2022-2027 ($ billion)
- Exhibit 49: Chart on Offline – Year-over-year growth 2022-2027 (%)
- Exhibit 50: Data Table on Offline – Year-over-year growth 2022-2027 (%)
- 7.4 Online – Market size and forecast 2022-2027
- Exhibit 51: Chart on Online – Market size and forecast 2022-2027 ($ billion)
- Exhibit 52: Data Table on Online – Market size and forecast 2022-2027 ($ billion)
- Exhibit 53: Chart on Online – Year-over-year growth 2022-2027 (%)
- Exhibit 54: Data Table on Online – Year-over-year growth 2022-2027 (%)
- 7.5 Market opportunity by Distribution Channel
- Exhibit 55: Market opportunity by Distribution Channel ($ billion)
8 Customer Landscape
- 8.1 Customer landscape overview
- Exhibit 56: Analysis of price sensitivity, lifecycle, customer purchase basket, adoption rates, and purchase criteria
9 Geographic Landscape
- 9.1 Geographic segmentation
- Exhibit 57: Chart on Market share by geography 2022-2027 (%)
- Exhibit 58: Data Table on Market share by geography 2022-2027 (%)
- 9.2 Geographic comparison
- Exhibit 59: Chart on Geographic comparison
- Exhibit 60: Data Table on Geographic comparison
- 9.3 North America – Market size and forecast 2022-2027
- Exhibit 61: Chart on North America – Market size and forecast 2022-2027 ($ billion)
- Exhibit 62: Data Table on North America – Market size and forecast 2022-2027 ($ billion)
- Exhibit 63: Chart on North America – Year-over-year growth 2022-2027 (%)
- Exhibit 64: Data Table on North America – Year-over-year growth 2022-2027 (%)
- 9.4 Europe – Market size and forecast 2022-2027
- Exhibit 65: Chart on Europe – Market size and forecast 2022-2027 ($ billion)
- Exhibit 66: Data Table on Europe – Market size and forecast 2022-2027 ($ billion)
- Exhibit 67: Chart on Europe – Year-over-year growth 2022-2027 (%)
- Exhibit 68: Data Table on Europe – Year-over-year growth 2022-2027 (%)
- 9.5 APAC – Market size and forecast 2022-2027
- Exhibit 69: Chart on APAC – Market size and forecast 2022-2027 ($ billion)
- Exhibit 70: Data Table on APAC – Market size and forecast 2022-2027 ($ billion)
- Exhibit 71: Chart on APAC – Year-over-year growth 2022-2027 (%)
- Exhibit 72: Data Table on APAC – Year-over-year growth 2022-2027 (%)
- 9.6 Middle East and Africa – Market size and forecast 2022-2027
- Exhibit 73: Chart on Middle East and Africa – Market size and forecast 2022-2027 ($ billion)
- Exhibit 74: Data Table on Middle East and Africa – Market size and forecast 2022-2027 ($ billion)
- Exhibit 75: Chart on Middle East and Africa – Year-over-year growth 2022-2027 (%)
- Exhibit 76: Data Table on Middle East and Africa – Year-over-year growth 2022-2027 (%)
- 9.7 South America – Market size and forecast 2022-2027
- Exhibit 77: Chart on South America – Market size and forecast 2022-2027 ($ billion)
- Exhibit 78: Data Table on South America – Market size and forecast 2022-2027 ($ billion)
- Exhibit 79: Chart on South America – Year-over-year growth 2022-2027 (%)
- Exhibit 80: Data Table on South America – Year-over-year growth 2022-2027 (%)
- 9.8 US – Market size and forecast 2022-2027
- Exhibit 81: Chart on US – Market size and forecast 2022-2027 ($ billion)
- Exhibit 82: Data Table on US – Market size and forecast 2022-2027 ($ billion)
- Exhibit 83: Chart on US – Year-over-year growth 2022-2027 (%)
- Exhibit 84: Data Table on US – Year-over-year growth 2022-2027 (%)
- 9.9 UK – Market size and forecast 2022-2027
- Exhibit 85: Chart on UK – Market size and forecast 2022-2027 ($ billion)
- Exhibit 86: Data Table on UK – Market size and forecast 2022-2027 ($ billion)
- Exhibit 87: Chart on UK – Year-over-year growth 2022-2027 (%)
- Exhibit 88: Data Table on UK – Year-over-year growth 2022-2027 (%)
- 9.10 Germany – Market size and forecast 2022-2027
- Exhibit 89: Chart on Germany – Market size and forecast 2022-2027 ($ billion)
- Exhibit 90: Data Table on Germany – Market size and forecast 2022-2027 ($ billion)
- Exhibit 91: Chart on Germany – Year-over-year growth 2022-2027 (%)
- Exhibit 92: Data Table on Germany – Year-over-year growth 2022-2027 (%)
- 9.11 Australia – Market size and forecast 2022-2027
- Exhibit 93: Chart on Australia – Market size and forecast 2022-2027 ($ billion)
- Exhibit 94: Data Table on Australia – Market size and forecast 2022-2027 ($ billion)
- Exhibit 95: Chart on Australia – Year-over-year growth 2022-2027 (%)
- Exhibit 96: Data Table on Australia – Year-over-year growth 2022-2027 (%)
- 9.12 Japan – Market size and forecast 2022-2027
- Exhibit 97: Chart on Japan – Market size and forecast 2022-2027 ($ billion)
- Exhibit 98: Data Table on Japan – Market size and forecast 2022-2027 ($ billion)
- Exhibit 99: Chart on Japan – Year-over-year growth 2022-2027 (%)
- Exhibit 100: Data Table on Japan – Year-over-year growth 2022-2027 (%)
- 9.13 Market opportunity by geography
- Exhibit 101: Market opportunity by geography ($ billion)
10 Drivers, Challenges, and Trends
- 10.1 Market drivers
- 10.2 Market challenges
- 10.3 Impact of drivers and challenges
- Exhibit 102: Impact of drivers and challenges in 2022 and 2027
- 10.4 Market trends
11 Vendor Landscape
- 11.1 Overview
- 11.2 Vendor landscape
- Exhibit 103: Overview on Criticality of inputs and Factors of differentiation
- 11.3 Landscape disruption
- Exhibit 104: Overview on factors of disruption
- 11.4 Industry risks
- Exhibit 105: Impact of key risks on business
12 Vendor Analysis
- 12.1 Vendors covered
- Exhibit 106: Vendors covered
- 12.2 Market positioning of vendors
- Exhibit 107: Matrix on vendor position and classification
- 12.3 Blackhawk Network Holdings Inc.
- Exhibit 108: Blackhawk Network Holdings Inc. – Overview
- Exhibit 109: Blackhawk Network Holdings Inc. – Product / Service
- Exhibit 110: Blackhawk Network Holdings Inc. – Key offerings
- 12.4 Card USA Inc
- Exhibit 111: Card USA Inc – Overview
- Exhibit 112: Card USA Inc – Product / Service
- Exhibit 113: Card USA Inc – Key offerings
- 12.5 Duracard LLC
- Exhibit 114: Duracard LLC – Overview
- Exhibit 115: Duracard LLC – Product / Service
- Exhibit 116: Duracard LLC – Key offerings
- 12.6 Fidelity National Information Services Inc.
- Exhibit 117: Fidelity National Information Services Inc. – Overview
- Exhibit 118: Fidelity National Information Services Inc. – Business segments
- Exhibit 119: Fidelity National Information Services Inc. – Key news
- Exhibit 120: Fidelity National Information Services Inc. – Key offerings
- Exhibit 121: Fidelity National Information Services Inc. – Segment focus
- 12.7 Fiserv Inc.
- Exhibit 122: Fiserv Inc. – Overview
- Exhibit 123: Fiserv Inc. – Business segments
- Exhibit 124: Fiserv Inc. – Key offerings
- Exhibit 125: Fiserv Inc. – Segment focus
- 12.8 FleetCor Technologies Inc.
- Exhibit 126: FleetCor Technologies Inc. – Overview
- Exhibit 127: FleetCor Technologies Inc. – Business segments
- Exhibit 128: FleetCor Technologies Inc. – Key offerings
- Exhibit 129: FleetCor Technologies Inc. – Segment focus
- 12.9 Givex Corp.
- Exhibit 130: Givex Corp. – Overview
- Exhibit 131: Givex Corp. – Product / Service
- Exhibit 132: Givex Corp. – Key offerings
- 12.10 InComm
- Exhibit 133: InComm – Overview
- Exhibit 134: InComm – Product / Service
- Exhibit 135: InComm – Key offerings
- 12.11 Jifiti.com Inc.
- Exhibit 136: Jifiti.com Inc. – Overview
- Exhibit 137: Jifiti.com Inc. – Product / Service
- Exhibit 138: Jifiti.com Inc. – Key offerings
- 12.12 Kindcard Inc.
- Exhibit 139: Kindcard Inc. – Overview
- Exhibit 140: Kindcard Inc. – Product / Service
- Exhibit 141: Kindcard Inc. – Key offerings
- 12.13 PineLabs Pvt. Ltd.
- Exhibit 142: PineLabs Pvt. Ltd. – Overview
- Exhibit 143: PineLabs Pvt. Ltd. – Product / Service
- Exhibit 144: PineLabs Pvt. Ltd. – Key offerings
- 12.14 Plastek Card Solutions Inc.
- Exhibit 145: Plastek Card Solutions Inc. – Overview
- Exhibit 146: Plastek Card Solutions Inc. – Product / Service
- Exhibit 147: Plastek Card Solutions Inc. – Key offerings
- 12.15 Square Inc.
- Exhibit 148: Square Inc. – Overview
- Exhibit 149: Square Inc. – Business segments
- Exhibit 150: Square Inc. – Key offerings
- Exhibit 151: Square Inc. – Segment focus
- 12.16 Tele Pak Inc
- Exhibit 152: Tele Pak Inc – Overview
- Exhibit 153: Tele Pak Inc – Product / Service
- Exhibit 154: Tele Pak Inc – Key offerings
- 12.17 The Voucher Market Ltd.
- Exhibit 155: The Voucher Market Ltd. – Overview
- Exhibit 156: The Voucher Market Ltd. – Product / Service
- Exhibit 157: The Voucher Market Ltd. – Key offerings
13 Appendix
- 13.1 Scope of the report
- 13.2 Inclusions and exclusions checklist
- Exhibit 158: Inclusions checklist
- Exhibit 159: Exclusions checklist
- 13.3 Currency conversion rates for US$
- Exhibit 160: Currency conversion rates for US$
- 13.4 Research methodology
- Exhibit 161: Research methodology
- Exhibit 162: Validation techniques employed for market sizing
- Exhibit 163: Information sources
- 13.5 List of abbreviations
- Exhibit 164: List of abbreviations
About Us
Technavio is a leading global technology research and advisory company. Their research and analysis focuses on emerging market trends and provides actionable insights to help businesses identify market opportunities and develop effective strategies to optimize their market positions. With over 500 specialized analysts, Technavio’s report library consists of more than 17,000 reports and counting, covering 800 technologies, spanning across 50 countries. Their client base consists of enterprises of all sizes, including more than 100 Fortune 500 companies. This growing client base relies on Technavio’s comprehensive coverage, extensive research, and actionable market insights to identify opportunities in existing and potential markets and assess their competitive positions within changing market scenarios.
Contact
Technavio Research
Jesse Maida
Media & Marketing Executive
US: +1 844 364 1100
UK: +44 203 893 3200
Email: media@technavio.com
Website: www.technavio.com/
![]()
![]() View original content to download multimedia:https://www.prnewswire.com/news-releases/gift-card-market-size-to-grow-by-usd-843-11-billion-between-2022-and-2027-blackhawk-network-holdings-inc-card-usa-inc-among-others-are-identified-as-key-vendors—technavio-301823505.html
View original content to download multimedia:https://www.prnewswire.com/news-releases/gift-card-market-size-to-grow-by-usd-843-11-billion-between-2022-and-2027-blackhawk-network-holdings-inc-card-usa-inc-among-others-are-identified-as-key-vendors—technavio-301823505.html
SOURCE Technavio
