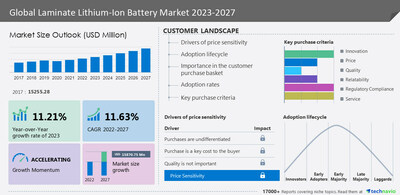
NEW YORK, Aug. 7, 2023 /PRNewswire/ — The laminate lithium-ion battery market size is projected to grow by USD 15,870.75 million from 2022 to 2027. However, the growth momentum will progress at a CAGR of 11.63% during the forecast period, according to Technavio. The laminate lithium-ion battery market is fragmented, and the companies are seeking strong partnerships with automotive, industrial, and commercial companies to compete in the market. Bright Volt, BYD Co. Ltd., Contemporary Amperex Technology Co. Ltd., EEMB, EnerSys, Exide Industries Ltd., GS Yuasa Corp., Hitachi Zosen Corp., Johnson Controls International Plc, LG Corp., LiPol Battery Co. Ltd., Murata Manufacturing Co. Ltd., NEC Corp., Nitto Denko Corp., Panasonic Holdings Corp., Renault SAS, Samsung Electronics Co. Ltd., Shenzhen Bak Battery Co. Ltd., TDK Corp., and Toshiba Corp. are some of the major market participants -. To know about the company’s offerings – Request a sample report

Laminate Lithium-Ion Battery Market 2023-2027: Scope
Technavio presents a detailed picture of the market by way of study, synthesis, and summation of data from multiple sources. The laminate lithium-ion battery market report covers the following areas:
- Laminate Lithium-Ion Battery Market Size
- Laminate Lithium-Ion Battery Market Trends
- Laminate Lithium-Ion Battery Market Industry Analysis
- Porter’s Five Forces Analysis
- Customer Landscape
Laminate Lithium-Ion Battery Market 2023-2027: Market Dynamics
Key Driver
Rising demand for high-performance batteries is a key factor driving market growth. Technological advances and consumer dependence on electronic devices have increased the demand for batteries that can provide long-lasting, reliable power. Moreover, the increasing demand for electric vehicles (EVs) is driven by governments setting targets to reduce carbon emissions. Laminated lithium-ion batteries are a popular choice for a variety of applications due to their lightweight, high-energy density, and rechargeable properties. Hence, these factors are expected to drive market growth during the forecast period.
Major Trends
Increasing adoption of EVs and hybrid electric vehicles is a major trend in the market. The growth is attributed to various factors, including government incentives, environmental concerns, and advancements in battery technology. EV and HEV manufacturers favor lithium-ion batteries for their high energy density, longer cycle life, and low self-discharge rate. As the demand for EVs and HEVs rises, the popularity of lithium-ion batteries is expected to continue to increase. Hence, these factors are expected to drive market growth during the forecast period.
Significant Challenges
The high cost of lithium-ion batteries is a significant challenge restricting market growth. Lithium-ion batteries are more expensive compared to other battery technologies due to the high cost of raw materials like cobalt and lithium used in their manufacturing process. This cost factor has limited their accessibility to consumers in developing countries where energy demands are rising rapidly. Hence, these factors are expected to restrict market growth during the forecast period.
Laminate Lithium-Ion Battery Market 2023-2027: Segment Analysis
- Type
- LiCoO2 Battery
- LiFePO4 Battery
- Lithium Nickel Manganese Cobalt and Others
- Application
- Consumer Electronics
- Automotive
- Others
- Geography
- APAC
- North America
- Europe
- South America
- Middle East and Africa
Laminate Lithium-Ion Battery Market 2023-2027: Segmentation Highlights
- The LiCoO2 battery segment will account for a major share of the market’s growth during the forecast period. LiCoO2 batteries are extensively used in various portable electronic devices like smartphones, laptops, and digital cameras due to their long cycle life and cost-effectiveness compared to other lithium-ion battery chemistries. Due to the widespread use of portable electronic devices and the growing demand for such devices, there is a significant need for reliable and efficient lithium-ion batteries like LiCoO2 batteries. Hence, these factors are expected to drive segment growth during the forecast period.
- APAC is estimated to contribute 49% to the growth of the global market during the forecast period. The market for laminate lithium-ion batteries is experiencing growth due to fast-growing economies, a rising population, and increasing demand for consumer electronics and electric vehicles (EVs). Furthermore, the growing emphasis on clean energy solutions and government initiatives promoting EV adoption are driving the demand for these batteries in the region. China, Japan, and South Korea are the major contributors to the region. Hence, these factors are expected to drive market growth in the region during the forecast period.
The competitive scenario categorizes companies based on various performance indicators. Some of the factors considered include the financial performance of companies, growth strategies, product innovations, new product launches, investments, and growth in market share, among others Buy the Report
Laminate Lithium-Ion Battery Market 2023-2027: Key Highlights
- CAGR of the market during the forecast period 2023-2027
- Detailed information on factors that will assist laminate lithium-ion battery market growth during the next five years.
- Estimation of the laminate lithium-ion battery market size and its contribution to the parent market
- Predictions on upcoming trends and changes in consumer behavior
- The growth of the laminate lithium-ion battery market across APAC, North America, Europe, South America, and the Middle East and Africa
- Analysis of the market’s competitive landscape and detailed information on companies
- Comprehensive details of factors that will challenge the growth of laminate lithium-ion battery market companies.
Get Instant access to 17000+ market research reports!
Technavio’s Subscription Platform
Related Reports:
The lithium-ion battery (LIB) separator market is estimated to grow at a CAGR of 10.91% from 2022 to 2027. The market size is forecast to increase by USD 2,526.16 million. Furthermore, this report extensively covers market segmentation by application (automotive and non-automotive), material (polyethylene, polypropylene, nylon, and others), and geography (APAC, Europe, North America, Middle East and Africa, and South America). The rising demand for smart devices is a key factor driving market growth during the forecast period.
The E-bike battery market is estimated to grow at a CAGR of 6.46% between 2022 and 2027. The market size is forecast to increase by USD 2,115.96 million. Furthermore, this report extensively covers market segmentation by distribution channel (offline and online), type (lead acid battery, Li-ion battery, and nickel-metal hydride (NIMH) battery), and geography (APAC, Europe, North America, South America, and Middle East and Africa). The longer shelf life of Li-ion batteries when compared with other battery technologies is a key factor driving market growth during the forecast period.
|
Laminate Lithium-Ion Battery Market Scope |
|
|
Report Coverage |
Details |
|
Base year |
2022 |
|
Historic period |
2017-2021 |
|
Forecast period |
2023-2027 |
|
Growth momentum & CAGR |
Accelerate at a CAGR of 11.63% |
|
Market growth 2023-2027 |
USD 15,870.75 million |
|
Market structure |
Fragmented |
|
YoY growth 2022-2023 (%) |
11.21 |
|
Regional analysis |
APAC, North America, Europe, South America, and Middle East and Africa |
|
Performing market contribution |
APAC at 49% |
|
Key countries |
US, China, Japan, India, and Germany |
|
Competitive landscape |
Leading Companies, Market Positioning of Companies, Competitive Strategies, and Industry Risks |
|
Key companies profiled |
BrightVolt, BYD Co. Ltd., Contemporary Amperex Technology Co. Ltd., EEMB, EnerSys, Exide Industries Ltd., GS Yuasa Corp., Hitachi Zosen Corp., Johnson Controls International Plc, LG Corp., LiPol Battery Co. Ltd., Murata Manufacturing Co. Ltd., NEC Corp., Nitto Denko Corp., Panasonic Holdings Corp., Renault SAS, Samsung Electronics Co. Ltd., Shenzhen Bak Battery Co. Ltd., TDK Corp., and Toshiba Corp. |
|
Market dynamics |
Parent market analysis, Market growth inducers and obstacles, Fast-growing and slow-growing segment analysis, COVID-19 impact and recovery analysis and future consumer dynamics, and Market condition analysis for the forecast period. |
|
Customization purview |
If our report has not included the data that you are looking for, you can reach out to our analysts and get segments customized. |
|
Customization purview |
If our report has not included the data that you are looking for, you can reach out to our analysts and get segments customized. |
Table of Contents
1 Executive Summary
- 1.1 Market Overview
- Exhibit 01: Executive Summary – Chart on Market Overview
- Exhibit 02: Executive Summary – Data Table on Market Overview
- Exhibit 03: Executive Summary – Chart on Global Market Characteristics
- Exhibit 04: Executive Summary – Chart on Market by Geography
- Exhibit 05: Executive Summary – Chart on Market Segmentation by Type
- Exhibit 06: Executive Summary – Chart on Market Segmentation by Application
- Exhibit 07: Executive Summary – Chart on Incremental Growth
- Exhibit 08: Executive Summary – Data Table on Incremental Growth
- Exhibit 09: Executive Summary – Chart on Company Market Positioning
2 Market Landscape
- 2.1 Market ecosystem
- Exhibit 10: Parent market
- Exhibit 11: Market Characteristics
3 Market Sizing
- 3.1 Market definition
- Exhibit 12: Offerings of companies included in the market definition
- 3.2 Market segment analysis
- Exhibit 13: Market segments
- 3.3 Market size 2022
- 3.4 Market outlook: Forecast for 2022-2027
- Exhibit 14: Chart on Global – Market size and forecast 2022-2027 ($ million)
- Exhibit 15: Data Table on Global – Market size and forecast 2022-2027 ($ million)
- Exhibit 16: Chart on Global Market: Year-over-year growth 2022-2027 (%)
- Exhibit 17: Data Table on Global Market: Year-over-year growth 2022-2027 (%)
4 Historic Market Size
- 4.1 Global laminate lithium-ion battery market 2017 – 2021
- Exhibit 18: Historic Market Size – Data Table on global laminate lithium-ion battery market 2017 – 2021 ($ million)
- 4.2 Type Segment Analysis 2017 – 2021
- Exhibit 19: Historic Market Size – Type Segment 2017 – 2021 ($ million)
- 4.3 Application Segment Analysis 2017 – 2021
- Exhibit 20: Historic Market Size – Application Segment 2017 – 2021 ($ million)
- 4.4 Geography Segment Analysis 2017 – 2021
- Exhibit 21: Historic Market Size – Geography Segment 2017 – 2021 ($ million)
- 4.5 Country Segment Analysis 2017 – 2021
- Exhibit 22: Historic Market Size – Country Segment 2017 – 2021 ($ million)
5 Five Forces Analysis
- 5.1 Five forces summary
- Exhibit 23: Five forces analysis – Comparison between 2022 and 2027
- 5.2 Bargaining power of buyers
- Exhibit 24: Chart on Bargaining power of buyers – Impact of key factors 2022 and 2027
- 5.3 Bargaining power of suppliers
- Exhibit 25: Bargaining power of suppliers – Impact of key factors in 2022 and 2027
- 5.4 Threat of new entrants
- Exhibit 26: Threat of new entrants – Impact of key factors in 2022 and 2027
- 5.5 Threat of substitutes
- Exhibit 27: Threat of substitutes – Impact of key factors in 2022 and 2027
- 5.6 Threat of rivalry
- Exhibit 28: Threat of rivalry – Impact of key factors in 2022 and 2027
- 5.7 Market condition
- Exhibit 29: Chart on Market condition – Five forces 2022 and 2027
6 Market Segmentation by Type
- 6.1 Market segments
- Exhibit 30: Chart on Type – Market share 2022-2027 (%)
- Exhibit 31: Data Table on Type – Market share 2022-2027 (%)
- 6.2 Comparison by Type
- Exhibit 32: Chart on Comparison by Type
- Exhibit 33: Data Table on Comparison by Type
- 6.3 LiCoO2 battery – Market size and forecast 2022-2027
- Exhibit 34: Chart on LiCoO2 battery – Market size and forecast 2022-2027 ($ million)
- Exhibit 35: Data Table on LiCoO2 battery – Market size and forecast 2022-2027 ($ million)
- Exhibit 36: Chart on LiCoO2 battery – Year-over-year growth 2022-2027 (%)
- Exhibit 37: Data Table on LiCoO2 battery – Year-over-year growth 2022-2027 (%)
- 6.4 LiFePO4 battery – Market size and forecast 2022-2027
- Exhibit 38: Chart on LiFePO4 battery – Market size and forecast 2022-2027 ($ million)
- Exhibit 39: Data Table on LiFePO4 battery – Market size and forecast 2022-2027 ($ million)
- Exhibit 40: Chart on LiFePO4 battery – Year-over-year growth 2022-2027 (%)
- Exhibit 41: Data Table on LiFePO4 battery – Year-over-year growth 2022-2027 (%)
- 6.5 Lithium Nickel Manganese Cobalt and Others – Market size and forecast 2022-2027
- Exhibit 42: Chart on Lithium Nickel Manganese Cobalt and Others – Market size and forecast 2022-2027 ($ million)
- Exhibit 43: Data Table on Lithium Nickel Manganese Cobalt and Others – Market size and forecast 2022-2027 ($ million)
- Exhibit 44: Chart on Lithium Nickel Manganese Cobalt and Others – Year-over-year growth 2022-2027 (%)
- Exhibit 45: Data Table on Lithium Nickel Manganese Cobalt and Others – Year-over-year growth 2022-2027 (%)
- 6.6 Market opportunity by Type
- Exhibit 46: Market opportunity by Type ($ million)
- Exhibit 47: Data Table on Market opportunity by Type ($ million)
7 Market Segmentation by Application
- 7.1 Market segments
- Exhibit 48: Chart on Application – Market share 2022-2027 (%)
- Exhibit 49: Data Table on Application – Market share 2022-2027 (%)
- 7.2 Comparison by Application
- Exhibit 50: Chart on Comparison by Application
- Exhibit 51: Data Table on Comparison by Application
- 7.3 Consumer electronics – Market size and forecast 2022-2027
- Exhibit 52: Chart on Consumer electronics – Market size and forecast 2022-2027 ($ million)
- Exhibit 53: Data Table on Consumer electronics – Market size and forecast 2022-2027 ($ million)
- Exhibit 54: Chart on Consumer electronics – Year-over-year growth 2022-2027 (%)
- Exhibit 55: Data Table on Consumer electronics – Year-over-year growth 2022-2027 (%)
- 7.4 Automotive – Market size and forecast 2022-2027
- Exhibit 56: Chart on Automotive – Market size and forecast 2022-2027 ($ million)
- Exhibit 57: Data Table on Automotive – Market size and forecast 2022-2027 ($ million)
- Exhibit 58: Chart on Automotive – Year-over-year growth 2022-2027 (%)
- Exhibit 59: Data Table on Automotive – Year-over-year growth 2022-2027 (%)
- 7.5 Others – Market size and forecast 2022-2027
- Exhibit 60: Chart on Others – Market size and forecast 2022-2027 ($ million)
- Exhibit 61: Data Table on Others – Market size and forecast 2022-2027 ($ million)
- Exhibit 62: Chart on Others – Year-over-year growth 2022-2027 (%)
- Exhibit 63: Data Table on Others – Year-over-year growth 2022-2027 (%)
- 7.6 Market opportunity by Application
- Exhibit 64: Market opportunity by Application ($ million)
- Exhibit 65: Data Table on Market opportunity by Application ($ million)
8 Customer Landscape
- 8.1 Customer landscape overview
- Exhibit 66: Analysis of price sensitivity, lifecycle, customer purchase basket, adoption rates, and purchase criteria
9 Geographic Landscape
- 9.1 Geographic segmentation
- Exhibit 67: Chart on Market share by geography 2022-2027 (%)
- Exhibit 68: Data Table on Market share by geography 2022-2027 (%)
- 9.2 Geographic comparison
- Exhibit 69: Chart on Geographic comparison
- Exhibit 70: Data Table on Geographic comparison
- 9.3 APAC – Market size and forecast 2022-2027
- Exhibit 71: Chart on APAC – Market size and forecast 2022-2027 ($ million)
- Exhibit 72: Data Table on APAC – Market size and forecast 2022-2027 ($ million)
- Exhibit 73: Chart on APAC – Year-over-year growth 2022-2027 (%)
- Exhibit 74: Data Table on APAC – Year-over-year growth 2022-2027 (%)
- 9.4 North America – Market size and forecast 2022-2027
- Exhibit 75: Chart on North America – Market size and forecast 2022-2027 ($ million)
- Exhibit 76: Data Table on North America – Market size and forecast 2022-2027 ($ million)
- Exhibit 77: Chart on North America – Year-over-year growth 2022-2027 (%)
- Exhibit 78: Data Table on North America – Year-over-year growth 2022-2027 (%)
- 9.5 Europe – Market size and forecast 2022-2027
- Exhibit 79: Chart on Europe – Market size and forecast 2022-2027 ($ million)
- Exhibit 80: Data Table on Europe – Market size and forecast 2022-2027 ($ million)
- Exhibit 81: Chart on Europe – Year-over-year growth 2022-2027 (%)
- Exhibit 82: Data Table on Europe – Year-over-year growth 2022-2027 (%)
- 9.6 South America – Market size and forecast 2022-2027
- Exhibit 83: Chart on South America – Market size and forecast 2022-2027 ($ million)
- Exhibit 84: Data Table on South America – Market size and forecast 2022-2027 ($ million)
- Exhibit 85: Chart on South America – Year-over-year growth 2022-2027 (%)
- Exhibit 86: Data Table on South America – Year-over-year growth 2022-2027 (%)
- 9.7 Middle East and Africa – Market size and forecast 2022-2027
- Exhibit 87: Chart on Middle East and Africa – Market size and forecast 2022-2027 ($ million)
- Exhibit 88: Data Table on Middle East and Africa – Market size and forecast 2022-2027 ($ million)
- Exhibit 89: Chart on Middle East and Africa – Year-over-year growth 2022-2027 (%)
- Exhibit 90: Data Table on Middle East and Africa – Year-over-year growth 2022-2027 (%)
- 9.8 China – Market size and forecast 2022-2027
- Exhibit 91: Chart on China – Market size and forecast 2022-2027 ($ million)
- Exhibit 92: Data Table on China – Market size and forecast 2022-2027 ($ million)
- Exhibit 93: Chart on China – Year-over-year growth 2022-2027 (%)
- Exhibit 94: Data Table on China – Year-over-year growth 2022-2027 (%)
- 9.9 US – Market size and forecast 2022-2027
- Exhibit 95: Chart on US – Market size and forecast 2022-2027 ($ million)
- Exhibit 96: Data Table on US – Market size and forecast 2022-2027 ($ million)
- Exhibit 97: Chart on US – Year-over-year growth 2022-2027 (%)
- Exhibit 98: Data Table on US – Year-over-year growth 2022-2027 (%)
- 9.10 Japan – Market size and forecast 2022-2027
- Exhibit 99: Chart on Japan – Market size and forecast 2022-2027 ($ million)
- Exhibit 100: Data Table on Japan – Market size and forecast 2022-2027 ($ million)
- Exhibit 101: Chart on Japan – Year-over-year growth 2022-2027 (%)
- Exhibit 102: Data Table on Japan – Year-over-year growth 2022-2027 (%)
- 9.11 Germany – Market size and forecast 2022-2027
- Exhibit 103: Chart on Germany – Market size and forecast 2022-2027 ($ million)
- Exhibit 104: Data Table on Germany – Market size and forecast 2022-2027 ($ million)
- Exhibit 105: Chart on Germany – Year-over-year growth 2022-2027 (%)
- Exhibit 106: Data Table on Germany – Year-over-year growth 2022-2027 (%)
- 9.12 India – Market size and forecast 2022-2027
- Exhibit 107: Chart on India – Market size and forecast 2022-2027 ($ million)
- Exhibit 108: Data Table on India – Market size and forecast 2022-2027 ($ million)
- Exhibit 109: Chart on India – Year-over-year growth 2022-2027 (%)
- Exhibit 110: Data Table on India – Year-over-year growth 2022-2027 (%)
- 9.13 Market opportunity by geography
- Exhibit 111: Market opportunity by geography ($ million)
- Exhibit 112: Data Tables on Market opportunity by geography ($ million)
10 Drivers, Challenges, and Trends
- 10.1 Market drivers
- 10.2 Market challenges
- 10.3 Impact of drivers and challenges
- Exhibit 113: Impact of drivers and challenges in 2022 and 2027
- 10.4 Market trends
11 Company Landscape
- 11.1 Overview
- 11.2 Company landscape
- Exhibit 114: Overview on Criticality of inputs and Factors of differentiation
- 11.3 Landscape disruption
- Exhibit 115: Overview on factors of disruption
- 11.4 Industry risks
- Exhibit 116: Impact of key risks on business
12 Company Analysis
- 12.1 Companies covered
- Exhibit 117: Companies covered
- 12.2 Market positioning of companies
- Exhibit 118: Matrix on company position and classification
- 12.3 BrightVolt
- Exhibit 119: BrightVolt – Overview
- Exhibit 120: BrightVolt – Product / Service
- Exhibit 121: BrightVolt – Key offerings
- 12.4 BYD Co. Ltd.
- Exhibit 122: BYD Co. Ltd. – Overview
- Exhibit 123: BYD Co. Ltd. – Business segments
- Exhibit 124: BYD Co. Ltd. – Key news
- Exhibit 125: BYD Co. Ltd. – Key offerings
- Exhibit 126: BYD Co. Ltd. – Segment focus
- 12.5 Contemporary Amperex Technology Co. Ltd.
- Exhibit 127: Contemporary Amperex Technology Co. Ltd. – Overview
- Exhibit 128: Contemporary Amperex Technology Co. Ltd. – Product / Service
- Exhibit 129: Contemporary Amperex Technology Co. Ltd. – Key offerings
- 12.6 EEMB
- Exhibit 130: EEMB – Overview
- Exhibit 131: EEMB – Product / Service
- Exhibit 132: EEMB – Key offerings
- 12.7 Hitachi Zosen Corp.
- Exhibit 133: Hitachi Zosen Corp. – Overview
- Exhibit 134: Hitachi Zosen Corp. – Business segments
- Exhibit 135: Hitachi Zosen Corp. – Key offerings
- Exhibit 136: Hitachi Zosen Corp. – Segment focus
- 12.8 LG Corp.
- Exhibit 137: LG Corp. – Overview
- Exhibit 138: LG Corp. – Business segments
- Exhibit 139: LG Corp. – Key offerings
- Exhibit 140: LG Corp. – Segment focus
- 12.9 LiPol Battery Co. Ltd.
- Exhibit 141: LiPol Battery Co. Ltd. – Overview
- Exhibit 142: LiPol Battery Co. Ltd. – Product / Service
- Exhibit 143: LiPol Battery Co. Ltd. – Key offerings
- 12.10 Murata Manufacturing Co. Ltd.
- Exhibit 144: Murata Manufacturing Co. Ltd. – Overview
- Exhibit 145: Murata Manufacturing Co. Ltd. – Business segments
- Exhibit 146: Murata Manufacturing Co. Ltd. – Key news
- Exhibit 147: Murata Manufacturing Co. Ltd. – Key offerings
- Exhibit 148: Murata Manufacturing Co. Ltd. – Segment focus
- 12.11 NEC Corp.
- Exhibit 149: NEC Corp. – Overview
- Exhibit 150: NEC Corp. – Business segments
- Exhibit 151: NEC Corp. – Key news
- Exhibit 152: NEC Corp. – Key offerings
- Exhibit 153: NEC Corp. – Segment focus
- 12.12 Nitto Denko Corp.
- Exhibit 154: Nitto Denko Corp. – Overview
- Exhibit 155: Nitto Denko Corp. – Business segments
- Exhibit 156: Nitto Denko Corp. – Key offerings
- Exhibit 157: Nitto Denko Corp. – Segment focus
- 12.13 Panasonic Holdings Corp.
- Exhibit 158: Panasonic Holdings Corp. – Overview
- Exhibit 159: Panasonic Holdings Corp. – Business segments
- Exhibit 160: Panasonic Holdings Corp. – Key news
- Exhibit 161: Panasonic Holdings Corp. – Key offerings
- Exhibit 162: Panasonic Holdings Corp. – Segment focus
- 12.14 Renault SAS
- Exhibit 163: Renault SAS – Overview
- Exhibit 164: Renault SAS – Product / Service
- Exhibit 165: Renault SAS – Key offerings
- 12.15 Samsung Electronics Co. Ltd.
- Exhibit 166: Samsung Electronics Co. Ltd. – Overview
- Exhibit 167: Samsung Electronics Co. Ltd. – Business segments
- Exhibit 168: Samsung Electronics Co. Ltd. – Key news
- Exhibit 169: Samsung Electronics Co. Ltd. – Key offerings
- Exhibit 170: Samsung Electronics Co. Ltd. – Segment focus
- 12.16 Shenzhen Bak Battery Co. Ltd.
- Exhibit 171: Shenzhen Bak Battery Co. Ltd. – Overview
- Exhibit 172: Shenzhen Bak Battery Co. Ltd. – Product / Service
- Exhibit 173: Shenzhen Bak Battery Co. Ltd. – Key offerings
- 12.17 TDK Corp.
- Exhibit 174: TDK Corp. – Overview
- Exhibit 175: TDK Corp. – Business segments
- Exhibit 176: TDK Corp. – Key news
- Exhibit 177: TDK Corp. – Key offerings
- Exhibit 178: TDK Corp. – Segment focus
13 Appendix
- 13.1 Scope of the report
- 13.2 Inclusions and exclusions checklist
- Exhibit 179: Inclusions checklist
- Exhibit 180: Exclusions checklist
- 13.3 Currency conversion rates for US$
- Exhibit 181: Currency conversion rates for US$
- 13.4 Research methodology
- Exhibit 182: Research methodology
- Exhibit 183: Validation techniques employed for market sizing
- Exhibit 184: Information sources
- 13.5 List of abbreviations
- Exhibit 185: List of abbreviations
About Us
Technavio is a leading global technology research and advisory company. Their research and analysis focus on emerging market trends and provide actionable insights to help businesses identify market opportunities and develop effective strategies to optimize their market positions. With over 500 specialized analysts, Technavio’s report library consists of more than 17,000 reports and counting, covering 800 technologies, spanning 50 countries. Their client base consists of enterprises of all sizes, including more than 100 Fortune 500 companies. This growing client base relies on Technavio’s comprehensive coverage, extensive research, and actionable market insights to identify opportunities in existing and potential markets and assess their competitive positions within changing market scenarios.
Contact
Technavio Research
Jesse Maida
Media & Marketing Executive
US: +1 844 364 1100
UK: +44 203 893 3200
Email: media@technavio.com
Website: www.technavio.com
![]()
![]() View original content to download multimedia:https://www.prnewswire.com/news-releases/laminate-lithium-ion-battery-market-size-to-grow-by-usd-15-870-75-million-from-2022-to-2027growth-driven-by-increasing-demand-for-high-performance-batteries—technavio-301894247.html
View original content to download multimedia:https://www.prnewswire.com/news-releases/laminate-lithium-ion-battery-market-size-to-grow-by-usd-15-870-75-million-from-2022-to-2027growth-driven-by-increasing-demand-for-high-performance-batteries—technavio-301894247.html
SOURCE Technavio
