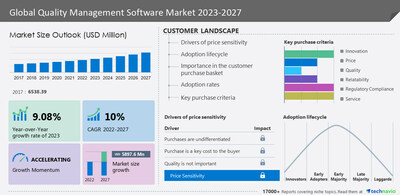
NEW YORK, Aug. 4, 2023 /PRNewswire/ — The quality management software market is set to grow by USD 5,897.6 million from 2022 to 2027 progressing at a CAGR of 10% during the forecast period. The report offers an up-to-date analysis regarding the current global market scenario, the latest trends and drivers, and the overall market environment. The rise in the adoption of cloud-based quality management software offerings is the major factor notably driving the global QMS market growth. Globally, the adoption of cloud computing is rapidly increasing, due to the flexibility and cost benefits associated with cloud services. Organizations are focusing globally on lowering their overall capital expenditure (CAPEX) and are looking to embrace new advanced technologies with lower CAPEX. Moreover, small-scale businesses and startups are adopting cloud solutions to leverage the scalability of the hardware and resources delivered by cloud providers. With the advancement in the adoption of cloud-based software, vendors in the market have started to deliver cloud-based quality management software. Therefore, due to enhanced accessibility and scalability, the demand for cloud-based quality management software from end-user industries is further expected to drive the growth of the market during the forecast period. Here is an Exclusive report talking about Market scenarios with a historical period (2017-2021) and a forecast period (2023-2027). Download Sample Report in minutes!

The quality management software market covers the following areas:
- Quality Management Software Market Sizing
- Quality Management Software Market Forecast
- Quality Management Software Market Analysis
The report on the quality management software market provides a holistic update, market size and forecast, trends, growth drivers, and challenges, as well as vendor analysis.
Quality Management Software Market 2023-2027 – Market Dynamics
Major Trends
The primary trend in the global QMS market is the growing adoption of SaaS-based quality management software solutions. The increasing popularity of SaaS-based quality management software solutions among enterprises has urged their adoption. For faster and cost-effective implementation of such software, SMEs are moving toward SaaS-based quality management software. It does not installation of any software because the software is maintained by the vendor data centre, from where users access it on a subscription basis. Due to its enhanced data security and scalability and relatively low upfront cost, the adoption of SaaS-based quality management software is expected to increase among SMEs. Among SMEs, SaaS deployment has been witnessing increasing adoption as they do not have the needed IT infrastructure. Also, SaaS eliminates the acquisition costs as well as the cost of long-term hardware and software upgrades. Therefore, it delivers a very economical solution to SMEs and other end-users, which is anticipated to drive the growth of the market during the forecast period.
Significant Challenges
The threat from open-source quality management software providers is a major challenge that may impede the QMS market growth. One of the major challenges in the market is the presence of many open-source quality management software providers. Globally, the quality management software market has many open-source vendors that provide a range of quality management software tools and applications. By incorporating numerous products from different open-source vendors, an end-user can cover almost all the functionalities provided by on-premises or cloud quality management software vendors. Currently, in developing countries, such as India and China, open-source quality management software is becoming increasingly popular, as most small-scale enterprises/SMEs in these economies cannot afford to invest in expensive on-premises and cloud-based quality management software. Therefore, such factors will adversely affect the revenue and market share of quality management software vendors during the forecast period.
What’s New? –
- Special coverage on the Russia–Ukraine war; global inflation; recovery analysis from COVID-19; supply chain disruptions, global trade tensions; and risk of recession
- Global competitiveness and key competitor positions
- Market presence across multiple geographical footprints – Strong/Active/Niche/Trivial – Buy the report!
Quality Management Software Market 2023-2027: Market Segmentation
The quality management software market segmentation by application (IT and telecom, transportation and logistics, consumer goods and retail, healthcare, and banking), deployment (on-premise and cloud-based), and geography (North America, Europe, APAC, Middle East and Africa, and South America).
- The market share growth of the IT and telecom segment will be significant during the forecast period. The telecom and IT segment include IT and telecommunication companies. These companies are expanding their emphasis on attracting, hiring, developing, and retaining the right talent to meet organizational goals. To manage human capital, which helps them meet both long-term and short-term goals, they are focusing on quality management technologies. To achieve human capital efficiency, telecom and IT organizations are leveraging quality management software at a fast pace. The necessity for expertise in advanced technologies plays a significant role in the efficient management of business functions. With the increase in the hiring of independent contractors and freelancers instead of full-time employees in the industry, quality management in telecom and IT companies is changing. This is because operators are more focused on reducing their network infrastructure deployment costs. Moreover, this expands the company’s flexibility in quality management based on project availability. Also, the rising mergers and acquisitions among prominent industry players are driving the implementation of quality management software in HR functions. M and A improve the competitive advantage of a company with new quality management and better changes in management. Therefore, such factors will fuel the growth of the segment during the forecast period.
This report presents a detailed picture of the market by way of study, synthesis, and summation of data from multiple sources through an analysis of key parameters– View Sample Report
Companies Mentioned
- Aras Corp.
- Cority Software Inc.
- Dassault Systemes SE
- Hewlett Packard Enterprise Co.
- Hexagon AB
- Honeywell International Inc.
- Intelex Technologies ULC
- IQVIA Holdings Inc.
- MasterControl Inc.
- MetricStream Inc.
- Microsoft Corp.
- Oracle Corp.
- Parasoft Corp.
- PSC Software
- QT9 Software Inc.
- Siemens AG
- UniPoint Software Inc.
- Autodesk Inc.
- SAP SE
- Wolters Kluwer NV
Vendor Offerings
- Aras Corp. – The company offers quality management software such as the Aras quality management system.
- Cority Software Inc. – The company offers quality management software such as PLM.
- Dassault Systemes SE – The company offers quality management software such as Cority Quality Cloud.
Gain instant access to 17,000+ market research reports.
Technavio’s SUBSCRIPTION platform
Related Reports
The risk management software market size is estimated to grow at a CAGR of 15.32% between 2022 and 2027. The market size is forecast to increase by USD 7,372.29 million. This report extensively covers market segmentation by component (software and services), deployment (on-premises and cloud), and geography (North America, Europe, APAC, South America, and the Middle East and Africa). One of the key factors driving the risk management software market growth is an increase in data and security breaches among enterprises.
The property management market size is estimated to grow at a CAGR of 2.73% between 2022 and 2027. The market size is forecast to increase by USD 49.45 billion. This report extensively covers market segmentation by Application (construction and real estate, government, retail, hospitality, and others), Deployment (cloud-based and on-premise), and Geography (North America, Europe, APAC, South America, and Middle East and Africa). The adherence to industry and government regulations for property listings is notably driving the market growth.
|
Quality Management Software Market Scope |
|
|
Report Coverage |
Details |
|
Base year |
2022 |
|
Historic period |
2017-2021 |
|
Forecast period |
2023-2027 |
|
Growth momentum & CAGR |
Accelerate at a CAGR of 10% |
|
Market growth 2023-2027 |
USD 5,897.6 million |
|
Market structure |
Fragmented |
|
YoY growth 2022-2023(%) |
9.08 |
|
Regional analysis |
North America, Europe, APAC, Middle East and Africa, and South America |
|
Performing market contribution |
North America at 32% |
|
Key countries |
US, China, Japan, Germany, and the UK |
|
Competitive landscape |
Leading Vendors, Market Positioning of Vendors, Competitive Strategies, and Industry Risks |
|
Key companies profiled |
Aras Corp., Cority Software Inc., Dassault Systemes SE, Hewlett Packard Enterprise Co., Hexagon AB, Honeywell International Inc., Intelex Technologies ULC, IQVIA Holdings Inc., MasterControl Inc., MetricStream Inc., Microsoft Corp., Oracle Corp., Parasoft Corp., PSC Software, QT9 Software Inc., Siemens AG, UniPoint Software Inc., Autodesk Inc., SAP SE, and Wolters Kluwer NV |
|
Market dynamics |
Parent market analysis, Market growth inducers and obstacles, Fast-growing and slow-growing segment analysis, COVID-19 impact and recovery analysis and future consumer dynamics, Market condition analysis for the forecast period |
|
Customization purview |
If our report has not included the data that you are looking for, you can reach out to our analysts and get segments customized. |
Key Topics Covered:
1 Executive Summary
- 1.1 Market Overview
- Exhibit 01: Executive Summary – Chart on Market Overview
- Exhibit 02: Executive Summary – Data Table on Market Overview
- Exhibit 03: Executive Summary – Chart on Global Market Characteristics
- Exhibit 04: Executive Summary – Chart of Market by Geography
- Exhibit 05: Executive Summary – Chart on Market Segmentation by Application
- Exhibit 06: Executive Summary – Chart on Market Segmentation by Deployment
- Exhibit 07: Executive Summary – Chart on Incremental Growth
- Exhibit 08: Executive Summary – Data Table on Incremental Growth
- Exhibit 09: Executive Summary – Chart on Vendor Market Positioning
2 Market Landscape
- 2.1 Market ecosystem
- Exhibit 10: Parent market
- Exhibit 11: Market Characteristics
3 Market Sizing
- 3.1 Market definition
- Exhibit 12: Offerings of vendors included in the market definition
- 3.2 Market segment analysis
- Exhibit 13: Market segments
- 3.3 Market size 2022
- 3.4 Market outlook: Forecast for 2022-2027
- Exhibit 14: Chart on Global – Market size and forecast 2022-2027 ($ million)
- Exhibit 15: Data Table on Global – Market size and forecast 2022-2027 ($ million)
- Exhibit 16: Chart on Global Market: Year-over-year growth 2022-2027 (%)
- Exhibit 17: Data Table on Global Market: Year-over-year growth 2022-2027 (%)
4 Historic Market Size
- 4.1 Global quality management software market 2017 – 2021
- Exhibit 18: Historic Market Size – Data Table on Global quality management software market 2017 – 2021 ($ million)
- 4.2 Application Segment Analysis 2017 – 2021
- Exhibit 19: Historic Market Size – Application Segment 2017 – 2021 ($ million)
- 4.3 Deployment Segment Analysis 2017 – 2021
- Exhibit 20: Historic Market Size – Deployment Segment 2017 – 2021 ($ million)
- 4.4 Geography Segment Analysis 2017 – 2021
- Exhibit 21: Historic Market Size – Geography Segment 2017 – 2021 ($ million)
- 4.5 Country Segment Analysis 2017 – 2021
- Exhibit 22: Historic Market Size – Country Segment 2017 – 2021 ($ million)
5 Five Forces Analysis
- 5.1 Five forces summary
- Exhibit 23: Five forces analysis – Comparison between 2022 and 2027
- 5.2 Bargaining power of buyers
- Exhibit 24: Chart on Bargaining power of buyers – Impact of key factors 2022 and 2027
- 5.3 Bargaining power of suppliers
- Exhibit 25: Bargaining power of suppliers – Impact of key factors in 2022 and 2027
- 5.4 Threat of new entrants
- Exhibit 26: Threat of new entrants – Impact of key factors in 2022 and 2027
- 5.5 Threat of substitutes
- Exhibit 27: Threat of substitutes – Impact of key factors in 2022 and 2027
- 5.6 Threat of rivalry
- Exhibit 28: Threat of rivalry – Impact of key factors in 2022 and 2027
- 5.7 Market condition
- Exhibit 29: Chart on Market condition – Five forces 2022 and 2027
6 Market Segmentation by Application
- 6.1 Market segments
- Exhibit 30: Chart on Application – Market share 2022-2027 (%)
- Exhibit 31: Data Table on Application – Market share 2022-2027 (%)
- 6.2 Comparison by Application
- Exhibit 32: Chart on Comparison by Application
- Exhibit 33: Data Table on Comparison by Application
- 6.3 IT and telecom – Market size and forecast 2022-2027
- Exhibit 34: Chart on IT and telecom – Market size and forecast 2022-2027 ($ million)
- Exhibit 35: Data Table on IT and telecom – Market size and forecast 2022-2027 ($ million)
- Exhibit 36: Chart on IT and telecom – Year-over-year growth 2022-2027 (%)
- Exhibit 37: Data Table on IT and telecom – Year-over-year growth 2022-2027 (%)
- 6.4 Transportation and logistics – Market size and forecast 2022-2027
- Exhibit 38: Chart on Transportation and logistics – Market size and forecast 2022-2027 ($ million)
- Exhibit 39: Data Table on Transportation and logistics – Market size and forecast 2022-2027 ($ million)
- Exhibit 40: Chart on Transportation and logistics – Year-over-year growth 2022-2027 (%)
- Exhibit 41: Data Table on Transportation and logistics – Year-over-year growth 2022-2027 (%)
- 6.5 Consumer goods and retail – Market size and forecast 2022-2027
- Exhibit 42: Chart on Consumer goods and retail – Market size and forecast 2022-2027 ($ million)
- Exhibit 43: Data Table on Consumer goods and retail – Market size and forecast 2022-2027 ($ million)
- Exhibit 44: Chart on Consumer goods and retail – Year-over-year growth 2022-2027 (%)
- Exhibit 45: Data Table on Consumer goods and retail – Year-over-year growth 2022-2027 (%)
- 6.6 Healthcare – Market size and forecast 2022-2027
- Exhibit 46: Chart on Healthcare – Market size and forecast 2022-2027 ($ million)
- Exhibit 47: Data Table on Healthcare – Market size and forecast 2022-2027 ($ million)
- Exhibit 48: Chart on Healthcare – Year-over-year growth 2022-2027 (%)
- Exhibit 49: Data Table on Healthcare – Year-over-year growth 2022-2027 (%)
- 6.7 Banking – Market size and forecast 2022-2027
- Exhibit 50: Chart on Banking – Market size and forecast 2022-2027 ($ million)
- Exhibit 51: Data Table on Banking – Market size and forecast 2022-2027 ($ million)
- Exhibit 52: Chart on Banking – Year-over-year growth 2022-2027 (%)
- Exhibit 53: Data Table on Banking – Year-over-year growth 2022-2027 (%)
- 6.8 Market opportunity by Application
- Exhibit 54: Market opportunity by Application ($ million)
7 Market Segmentation by Deployment
- 7.1 Market segments
- Exhibit 55: Chart on Deployment – Market share 2022-2027 (%)
- Exhibit 56: Data Table on Deployment – Market share 2022-2027 (%)
- 7.2 Comparison by Deployment
- Exhibit 57: Chart on Comparison by Deployment
- Exhibit 58: Data Table on Comparison by Deployment
- 7.3 On-premise – Market size and forecast 2022-2027
- Exhibit 59: Chart on On-premise – Market size and forecast 2022-2027 ($ million)
- Exhibit 60: Data Table on On-premise – Market size and forecast 2022-2027 ($ million)
- Exhibit 61: Chart on On-premise – Year-over-year growth 2022-2027 (%)
- Exhibit 62: Data Table on On-premise – Year-over-year growth 2022-2027 (%)
- 7.4 Cloud-based – Market size and forecast 2022-2027
- Exhibit 63: Chart on Cloud-based – Market size and forecast 2022-2027 ($ million)
- Exhibit 64: Data Table on Cloud-based – Market size and forecast 2022-2027 ($ million)
- Exhibit 65: Chart on Cloud-based – Year-over-year growth 2022-2027 (%)
- Exhibit 66: Data Table on Cloud-based – Year-over-year growth 2022-2027 (%)
- 7.5 Market opportunity by Deployment
- Exhibit 67: Market opportunity by Deployment ($ million)
8 Customer Landscape
- 8.1 Customer landscape overview
- Exhibit 68: Analysis of price sensitivity, lifecycle, customer purchase basket, adoption rates, and purchase criteria
9 Geographic Landscape
- 9.1 Geographic segmentation
- Exhibit 69: Chart on Market share by geography 2022-2027 (%)
- Exhibit 70: Data Table on Market share by geography 2022-2027 (%)
- 9.2 Geographic comparison
- Exhibit 71: Chart on Geographic comparison
- Exhibit 72: Data Table on Geographic comparison
- 9.3 North America – Market size and forecast 2022-2027
- Exhibit 73: Chart on North America – Market size and forecast 2022-2027 ($ million)
- Exhibit 74: Data Table on North America – Market size and forecast 2022-2027 ($ million)
- Exhibit 75: Chart on North America – Year-over-year growth 2022-2027 (%)
- Exhibit 76: Data Table on North America – Year-over-year growth 2022-2027 (%)
- 9.4 Europe – Market size and forecast 2022-2027
- Exhibit 77: Chart on Europe – Market size and forecast 2022-2027 ($ million)
- Exhibit 78: Data Table on Europe – Market size and forecast 2022-2027 ($ million)
- Exhibit 79: Chart on Europe – Year-over-year growth 2022-2027 (%)
- Exhibit 80: Data Table on Europe – Year-over-year growth 2022-2027 (%)
- 9.5 APAC – Market size and forecast 2022-2027
- Exhibit 81: Chart on APAC – Market size and forecast 2022-2027 ($ million)
- Exhibit 82: Data Table on APAC – Market size and forecast 2022-2027 ($ million)
- Exhibit 83: Chart on APAC – Year-over-year growth 2022-2027 (%)
- Exhibit 84: Data Table on APAC – Year-over-year growth 2022-2027 (%)
- 9.6 Middle East and Africa – Market size and forecast 2022-2027
- Exhibit 85: Chart on Middle East and Africa – Market size and forecast 2022-2027 ($ million)
- Exhibit 86: Data Table on Middle East and Africa – Market size and forecast 2022-2027 ($ million)
- Exhibit 87: Chart on Middle East and Africa – Year-over-year growth 2022-2027 (%)
- Exhibit 88: Data Table on Middle East and Africa – Year-over-year growth 2022-2027 (%)
- 9.7 South America – Market size and forecast 2022-2027
- Exhibit 89: Chart on South America – Market size and forecast 2022-2027 ($ million)
- Exhibit 90: Data Table on South America – Market size and forecast 2022-2027 ($ million)
- Exhibit 91: Chart on South America – Year-over-year growth 2022-2027 (%)
- Exhibit 92: Data Table on South America – Year-over-year growth 2022-2027 (%)
- 9.8 US – Market size and forecast 2022-2027
- Exhibit 93: Chart on US – Market size and forecast 2022-2027 ($ million)
- Exhibit 94: Data Table on US – Market size and forecast 2022-2027 ($ million)
- Exhibit 95: Chart on US – Year-over-year growth 2022-2027 (%)
- Exhibit 96: Data Table on US – Year-over-year growth 2022-2027 (%)
- 9.9 China – Market size and forecast 2022-2027
- Exhibit 97: Chart on China – Market size and forecast 2022-2027 ($ million)
- Exhibit 98: Data Table on China – Market size and forecast 2022-2027 ($ million)
- Exhibit 99: Chart on China – Year-over-year growth 2022-2027 (%)
- Exhibit 100: Data Table on China – Year-over-year growth 2022-2027 (%)
- 9.10 UK – Market size and forecast 2022-2027
- Exhibit 101: Chart on UK – Market size and forecast 2022-2027 ($ million)
- Exhibit 102: Data Table on UK – Market size and forecast 2022-2027 ($ million)
- Exhibit 103: Chart on UK – Year-over-year growth 2022-2027 (%)
- Exhibit 104: Data Table on UK – Year-over-year growth 2022-2027 (%)
- 9.11 Germany – Market size and forecast 2022-2027
- Exhibit 105: Chart on Germany – Market size and forecast 2022-2027 ($ million)
- Exhibit 106: Data Table on Germany – Market size and forecast 2022-2027 ($ million)
- Exhibit 107: Chart on Germany – Year-over-year growth 2022-2027 (%)
- Exhibit 108: Data Table on Germany – Year-over-year growth 2022-2027 (%)
- 9.12 Japan – Market size and forecast 2022-2027
- Exhibit 109: Chart on Japan – Market size and forecast 2022-2027 ($ million)
- Exhibit 110: Data Table on Japan – Market size and forecast 2022-2027 ($ million)
- Exhibit 111: Chart on Japan – Year-over-year growth 2022-2027 (%)
- Exhibit 112: Data Table on Japan – Year-over-year growth 2022-2027 (%)
- 9.13 Market opportunity by geography
- Exhibit 113: Market opportunity by geography ($ million)
10 Drivers, Challenges, and Trends
- 10.1 Market drivers
- 10.2 Market challenges
- 10.3 Impact of drivers and challenges
- Exhibit 114: Impact of drivers and challenges in 2022 and 2027
- 10.4 Market trends
11 Vendor Landscape
- 11.1 Overview
- 11.2 Vendor landscape
- Exhibit 115: Overview on Criticality of inputs and Factors of differentiation
- 11.3 Landscape disruption
- Exhibit 116: Overview on factors of disruption
- 11.4 Industry risks
- Exhibit 117: Impact of key risks on business
12 Vendor Analysis
- 12.1 Vendors covered
- Exhibit 118: Vendors covered
- 12.2 Market positioning of vendors
- Exhibit 119: Matrix on vendor position and classification
- 12.3 Aras Corp.
- Exhibit 120: Aras Corp. – Overview
- Exhibit 121: Aras Corp. – Product / Service
- Exhibit 122: Aras Corp. – Key news
- Exhibit 123: Aras Corp. – Key offerings
- 12.4 Autodesk Inc.
- Exhibit 124: Autodesk Inc. – Overview
- Exhibit 125: Autodesk Inc. – Product / Service
- Exhibit 126: Autodesk Inc. – Key news
- Exhibit 127: Autodesk Inc. – Key offerings
- 12.5 Cority Software Inc.
- Exhibit 128: Cority Software Inc. – Overview
- Exhibit 129: Cority Software Inc. – Product / Service
- Exhibit 130: Cority Software Inc. – Key offerings
- 12.6 Dassault Systemes SE
- Exhibit 131: Dassault Systemes SE – Overview
- Exhibit 132: Dassault Systemes SE – Product / Service
- Exhibit 133: Dassault Systemes SE – Key news
- Exhibit 134: Dassault Systemes SE – Key offerings
- 12.7 Hewlett Packard Enterprise Co.
- Exhibit 135: Hewlett Packard Enterprise Co. – Overview
- Exhibit 136: Hewlett Packard Enterprise Co. – Business segments
- Exhibit 137: Hewlett Packard Enterprise Co. – Key news
- Exhibit 138: Hewlett Packard Enterprise Co. – Key offerings
- Exhibit 139: Hewlett Packard Enterprise Co. – Segment focus
- 12.8 Hexagon AB
- Exhibit 140: Hexagon AB – Overview
- Exhibit 141: Hexagon AB – Business segments
- Exhibit 142: Hexagon AB – Key news
- Exhibit 143: Hexagon AB – Key offerings
- Exhibit 144: Hexagon AB – Segment focus
- 12.9 Honeywell International Inc.
- Exhibit 145: Honeywell International Inc. – Overview
- Exhibit 146: Honeywell International Inc. – Business segments
- Exhibit 147: Honeywell International Inc. – Key news
- Exhibit 148: Honeywell International Inc. – Key offerings
- Exhibit 149: Honeywell International Inc. – Segment focus
- 12.10 Intelex Technologies ULC
- Exhibit 150: Intelex Technologies ULC – Overview
- Exhibit 151: Intelex Technologies ULC – Product / Service
- Exhibit 152: Intelex Technologies ULC – Key offerings
- 12.11 MasterControl Inc.
- Exhibit 153: MasterControl Inc. – Overview
- Exhibit 154: MasterControl Inc. – Product / Service
- Exhibit 155: MasterControl Inc. – Key offerings
- 12.12 Microsoft Corp.
- Exhibit 156: Microsoft Corp. – Overview
- Exhibit 157: Microsoft Corp. – Business segments
- Exhibit 158: Microsoft Corp. – Key news
- Exhibit 159: Microsoft Corp. – Key offerings
- Exhibit 160: Microsoft Corp. – Segment focus
- 12.13 Oracle Corp.
- Exhibit 161: Oracle Corp. – Overview
- Exhibit 162: Oracle Corp. – Business segments
- Exhibit 163: Oracle Corp. – Key news
- Exhibit 164: Oracle Corp. – Key offerings
- Exhibit 165: Oracle Corp. – Segment focus
- 12.14 Parasoft Corp.
- Exhibit 166: Parasoft Corp. – Overview
- Exhibit 167: Parasoft Corp. – Product / Service
- Exhibit 168: Parasoft Corp. – Key offerings
- 12.15 PSC Software
- Exhibit 169: PSC Software – Overview
- Exhibit 170: PSC Software – Product / Service
- Exhibit 171: PSC Software – Key offerings
- 12.16 SAP SE
- Exhibit 172: SAP SE – Overview
- Exhibit 173: SAP SE – Business segments
- Exhibit 174: SAP SE – Key news
- Exhibit 175: SAP SE – Key offerings
- Exhibit 176: SAP SE – Segment focus
- 12.17 Siemens AG
- Exhibit 177: Siemens AG – Overview
- Exhibit 178: Siemens AG – Business segments
- Exhibit 179: Siemens AG – Key news
- Exhibit 180: Siemens AG – Key offerings
- Exhibit 181: Siemens AG – Segment focus
13 Appendix
- 13.1 Scope of the report
- 13.2 Inclusions and exclusions checklist
- Exhibit 182: Inclusions checklist
- Exhibit 183: Exclusions checklist
- 13.3 Currency conversion rates for US$
- Exhibit 184: Currency conversion rates for US$
- 13.4 Research methodology
- Exhibit 185: Research methodology
- Exhibit 186: Validation techniques employed for market sizing
- Exhibit 187: Information sources
- 13.5 List of abbreviations
- Exhibit 188: List of abbreviations
About Us
Technavio is a leading global technology research and advisory company. Their research and analysis focuses on emerging market trends and provides actionable insights to help businesses identify market opportunities and develop effective strategies to optimize their market positions. With over 500 specialized analysts, Technavio’s report library consists of more than 17,000 reports and counting, covering 800 technologies, spanning across 50 countries. Their client base consists of enterprises of all sizes, including more than 100 Fortune 500 companies. This growing client base relies on Technavio’s comprehensive coverage, extensive research, and actionable market insights to identify opportunities in existing and potential markets and assess their competitive positions within changing market scenarios.
Contact
Technavio Research
Jesse Maida
Media & Marketing Executive
US: +1 844 364 1100
UK: +44 203 893 3200
Email: media@technavio.com
Website: www.technavio.com
![]()
![]() View original content to download multimedia:https://www.prnewswire.com/news-releases/quality-management-software-market-to-grow-by-usd-5-897-6-million-from-2022-to-2027the-rise-in-the-adoption-of-cloud-based-quality-management-software-offerings-drives-the-market—technavio-301892888.html
View original content to download multimedia:https://www.prnewswire.com/news-releases/quality-management-software-market-to-grow-by-usd-5-897-6-million-from-2022-to-2027the-rise-in-the-adoption-of-cloud-based-quality-management-software-offerings-drives-the-market—technavio-301892888.html
SOURCE Technavio
