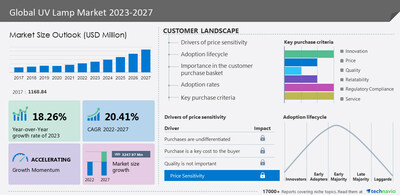
NEW YORK, July 17, 2023 /PRNewswire/ — The UV lamp market size is estimated to grow by USD 3,247.97 million from 2022 to 2027. The market is estimated to accelerate at a CAGR of 20.41%, according to Technavio. The growing competition in the market is compelling vendors to adopt various growth strategies, such as promotional activities and spending on advertisements to improve the visibility of their services. Technavio report analyzes the market’s competitive landscape and offers information on several market vendors, including AlphaCure Ltd., Atlantic Ultraviolet Corp., Broadcom Inc., Danaher Corp., DELO Industrie Klebstoffe GmbH and Co. KGaA, DOWA HOLDINGS Co. Ltd., Dr. Honle AG, Excelitas Technologies Corp., Heraeus Holding GmbH, IST Metz GmbH and Co. KG, Lumileds Holding BV, Luminus Inc., MaestroGen Inc., Nordson Corp., Panasonic Holdings Corp., Seoul Semiconductor Co. Ltd., Signify NV, Ushio America Inc., Vilber Lourmat est une SAS, Xylem Inc., Zchem Specialities Pvt. Ltd., Nichia Corp., Nikkiso Co. Ltd., OSRAM Licht AG, and SemiLEDs Corp. Download a Sample Report Now!

UV Lamp Market Insights –
- Vendors: 15+, Including AlphaCure Ltd., Atlantic Ultraviolet Corp., Broadcom Inc., Danaher Corp., DELO Industrie Klebstoffe GmbH and Co. KGaA, DOWA HOLDINGS Co. Ltd., Dr. Honle AG, Excelitas Technologies Corp., Heraeus Holding GmbH, IST Metz GmbH, and Co. KG, Lumileds Holding BV, Luminus Inc., MaestroGen Inc., Nordson Corp., Panasonic Holdings Corp., Seoul Semiconductor Co. Ltd., Signify NV, Ushio America Inc., Vilber Lourmat est une SAS, Xylem Inc., Zchem Specialities Pvt. Ltd., Nichia Corp., Nikkiso Co. Ltd., OSRAM Licht AG, and SemiLEDs Corp.
- Coverage: Parent market analysis; key drivers, major trends, and challenges; customer and vendor landscape; vendor product insights and recent developments; key vendors; and market positioning of vendors
- Segments: Product (Mercury-based UV lamps and UV LEDs), Application (UV Curing, Water and air purification, Tanning, Analytical instruments, and Others), and Geography (APAC, Europe, North America, South America, and the Middle East and Africa)
To understand more about the UV lamp market, request a sample report
Major Drivers – The low cost of ownership of UV LEDs drives the UV lamp market growth during the forecast period. Traditional UV lamps require secondary lenses as they have space and light limitations, whereas UV lamps eliminate the requirement for such secondary lenses. Even though the initial cost of UV lamps is high, they have a significantly long lifespan when compared to traditional mercury lamps. As a result, there is an increasing adoption of UV lamps among consumers in the market. Furthermore, several device manufacturers are exploring new market opportunities by offering new features due to the low cost of ownership of UV LED lamps. As a result, this enhances the relationship with existing customers, which will positively impact market growth. Hence, such factors are expected to drive the UV lamp market growth during the forecast period.
Significant Trends -The transition from mercury-based UV lamps to UV LED lamps is an emerging trend in the UV lamp market during the forecast period. There is an increasing restriction on the use of mercury-based lighting solutions, such as incandescent lamps, across several countries due to its various environmental concerns. As a result, it has led to the declining adoption of mercury-based UV lamps, which in turn fuelled the increased adoption of UV LEDs in these countries. One of the main advantages of UV LEDs is that they are mostly eco-friendly and are non-hazardous, as these LEDs are free of ozone and mercury. Additionally, some benefits of UV LEDs include energy-saving features and other properties that improve sustainability. As a result, there is increasing adoption of UV LED technology to minimize power supply costs and comply with the changes in legislation.
Key challenges – Health hazards associated with UV lamps are one of the significant challenges hindering the UV lamp market growth. Some of the main applications of UV lamps include UV curing, medical light therapy, and water sterilization, which emits invisible UV radiation during operations. On the other hand, there are several health concerns associated with UV radiation which can negatively impact the market. Some of the health hazards include damage to an individual’s eyes and skin, and consistent exposure to radiation can lead to skin cancer. Furthermore, several stringent regulations are enforced by the government bodies regarding the use of UV lamps for safety purposes which in turn can hinder the UV lamps market growth during the forecast period.
The UV lamp market report provides critical information and factual data, with a qualitative and quantitative study of the market based on market drivers and limitations as well as future prospects.
Why Buy?
- Add credibility to strategy
- Analyzes competitor’s offerings
- Get a holistic view of the market
Grow your profit margin with Technavio- Buy the Report
What are the key data covered in this UV Lamp Market report?
- CAGR of the market during the forecast period
- Detailed information on factors that will drive the growth of the UV lamp market between 2023 and 2027
- Precise estimation of the UV lamp market size and its contribution to the market with a focus on the parent market
- Accurate predictions about upcoming trends and changes in consumer behavior
- Growth of the UV lamp market across APAC, Europe, North America, South America, and the Middle East and Africa
- A thorough analysis of the market’s competitive landscape and detailed information about vendors
- Comprehensive analysis of factors that will challenge the growth of UV lamp market vendors
Gain instant access to 17,000+ market research reports.
Technavio’s SUBSCRIPTION platform
Related Reports:
The power management IC market size is estimated to grow at a CAGR of 4.97% between 2022 and 2027. The market size is forecast to increase by USD 9,309.01 million. This power management ic market report extensively covers market segmentation by product type (voltage regulators, motor control IC, integrated ASSP power management IC, battery management IC, and other power management IC), end-user (automotive and transportation, consumer electronics, industrial, telecom and networking, and others), and geography (APAC, Europe, North America, South America, and Middle East and Africa). The growing trend of smart buildings is driving growth in the power management IC market.
The grow light market size is estimated to grow at a CAGR of 15.76% between 2022 and 2027. The market size is forecast to increase by USD 7,472.08 million. This grows light market report extensively covers market segmentation by application (commercial greenhouse, vertical farming, indoor farming, and research), product (hid, led lights, fluorescent lights, and others), and geography (Europe, North America, APAC, Middle East and Africa, and South America). One of the key factors driving the global grow light market growth is the rising popularity of urban agriculture.
|
UV Lamp Market Scope |
|
|
Report Coverage |
Details |
|
Base year |
2022 |
|
Historic period |
2017-2021 |
|
Forecast period |
2023-2027 |
|
Growth momentum & CAGR |
Accelerate at a CAGR of 20.41% |
|
Market growth 2023-2027 |
USD 3,247.97 million |
|
Market structure |
Fragmented |
|
YoY growth 2022-2023 (%) |
18.26 |
|
Regional analysis |
APAC, Europe, North America, South America, and Middle East and Africa |
|
Performing market contribution |
APAC at 43% |
|
Key countries |
US, China, Japan, Germany, and the UK |
|
Competitive landscape |
Leading Vendors, Market Positioning of Vendors, Competitive Strategies, and Industry Risks |
|
Key companies profiled |
AlphaCure Ltd., Atlantic Ultraviolet Corp., Broadcom Inc., Danaher Corp., DELO Industrie Klebstoffe GmbH and Co. KGaA, DOWA HOLDINGS Co. Ltd., Dr. Honle AG, Excelitas Technologies Corp., Heraeus Holding GmbH, IST Metz GmbH and Co. KG, Lumileds Holding BV, Luminus Inc., MaestroGen Inc., Nordson Corp., Panasonic Holdings Corp., Seoul Semiconductor Co. Ltd., Signify NV, Ushio America Inc., Vilber Lourmat est une SAS, Xylem Inc., Zchem Specialities Pvt. Ltd., Nichia Corp., Nikkiso Co. Ltd., OSRAM Licht AG, and SemiLEDs Corp. |
|
Market dynamics |
Parent market analysis, Market growth inducers and obstacles, Fast-growing and slow-growing segment analysis, COVID-19 impact and recovery analysis and future consumer dynamics, and Market condition analysis for the forecast period. |
|
Customization purview |
If our report has not included the data that you are looking for, you can reach out to our analysts and get segments customized. |
Table of Contents
1 Executive Summary
- 1.1 Market overview
- Exhibit 01: Executive Summary – Chart on Market Overview
- Exhibit 02: Executive Summary – Data Table on Market Overview
- Exhibit 03: Executive Summary – Chart on Global Market Characteristics
- Exhibit 04: Executive Summary – Chart on Market by Geography
- Exhibit 05: Executive Summary – Chart on Market Segmentation by Product
- Exhibit 06: Executive Summary – Chart on Market Segmentation by Application
- Exhibit 07: Executive Summary – Chart on Incremental Growth
- Exhibit 08: Executive Summary – Data Table on Incremental Growth
- Exhibit 09: Executive Summary – Chart on Vendor Market Positioning
2 Market Landscape
- 2.1 Market ecosystem
- Exhibit 10: Parent market
- Exhibit 11: Market Characteristics
3 Market Sizing
- 3.1 Market definition
- Exhibit 12: Offerings of vendors included in the market definition
- 3.2 Market segment analysis
- Exhibit 13: Market segments
- 3.3 Market size 2022
- 3.4 Market outlook: Forecast for 2022-2027
- Exhibit 14: Chart on Global – Market size and forecast 2022-2027 ($ million)
- Exhibit 15: Data Table on Global – Market size and forecast 2022-2027 ($ million)
- Exhibit 16: Chart on Global Market: Year-over-year growth 2022-2027 (%)
- Exhibit 17: Data Table on Global Market: Year-over-year growth 2022-2027 (%)
4 Historic Market Size
- 4.1 Global UV lamp market 2017 – 2021
- Exhibit 18: Historic Market Size – Data Table on global uv lamp market 2017 – 2021 ($ million)
- 4.2 Product Segment Analysis 2017 – 2021
- Exhibit 19: Historic Market Size – Product Segment 2017 – 2021 ($ million)
- 4.3 Application Segment Analysis 2017 – 2021
- Exhibit 20: Historic Market Size – Application Segment 2017 – 2021 ($ million)
- 4.4 Geography Segment Analysis 2017 – 2021
- Exhibit 21: Historic Market Size – Geography Segment 2017 – 2021 ($ million)
- 4.5 Country Segment Analysis 2017 – 2021
- Exhibit 22: Historic Market Size – Country Segment 2017 – 2021 ($ million)
5 Five Forces Analysis
- 5.1 Five forces summary
- Exhibit 23: Five forces analysis – Comparison between 2022 and 2027
- 5.2 Bargaining power of buyers
- Exhibit 24: Chart on Bargaining power of buyers – Impact of key factors 2022 and 2027
- 5.3 Bargaining power of suppliers
- Exhibit 25: Bargaining power of suppliers – Impact of key factors in 2022 and 2027
- 5.4 Threat of new entrants
- Exhibit 26: Threat of new entrants – Impact of key factors in 2022 and 2027
- 5.5 Threat of substitutes
- Exhibit 27: Threat of substitutes – Impact of key factors in 2022 and 2027
- 5.6 Threat of rivalry
- Exhibit 28: Threat of rivalry – Impact of key factors in 2022 and 2027
- 5.7 Market condition
- Exhibit 29: Chart on Market condition – Five forces 2022 and 2027
6 Market Segmentation by Product
- 6.1 Market segments
- Exhibit 30: Chart on Product – Market share 2022-2027 (%)
- Exhibit 31: Data Table on Product – Market share 2022-2027 (%)
- 6.2 Comparison by Product
- Exhibit 32: Chart on Comparison by Product
- Exhibit 33: Data Table on Comparison by Product
- 6.3 Mercury-based UV lamps – Market size and forecast 2022-2027
- Exhibit 34: Chart on Mercury-based UV lamps – Market size and forecast 2022-2027 ($ million)
- Exhibit 35: Data Table on Mercury-based UV lamps – Market size and forecast 2022-2027 ($ million)
- Exhibit 36: Chart on Mercury-based UV lamps – Year-over-year growth 2022-2027 (%)
- Exhibit 37: Data Table on Mercury-based UV lamps – Year-over-year growth 2022-2027 (%)
- 6.4 UV LEDs – Market size and forecast 2022-2027
- Exhibit 38: Chart on UV LEDs – Market size and forecast 2022-2027 ($ million)
- Exhibit 39: Data Table on UV LEDs – Market size and forecast 2022-2027 ($ million)
- Exhibit 40: Chart on UV LEDs – Year-over-year growth 2022-2027 (%)
- Exhibit 41: Data Table on UV LEDs – Year-over-year growth 2022-2027 (%)
- 6.5 Market opportunity by Product
- Exhibit 42: Market opportunity by Product ($ million)
- Exhibit 43: Data Table on Market opportunity by Product ($ million)
7 Market Segmentation by Application
- 7.1 Market segments
- Exhibit 44: Chart on Application – Market share 2022-2027 (%)
- Exhibit 45: Data Table on Application – Market share 2022-2027 (%)
- 7.2 Comparison by Application
- Exhibit 46: Chart on Comparison by Application
- Exhibit 47: Data Table on Comparison by Application
- 7.3 UV Curing – Market size and forecast 2022-2027
- Exhibit 48: Chart on UV Curing – Market size and forecast 2022-2027 ($ million)
- Exhibit 49: Data Table on UV Curing – Market size and forecast 2022-2027 ($ million)
- Exhibit 50: Chart on UV Curing – Year-over-year growth 2022-2027 (%)
- Exhibit 51: Data Table on UV Curing – Year-over-year growth 2022-2027 (%)
- 7.4 Water and air purification – Market size and forecast 2022-2027
- Exhibit 52: Chart on Water and air purification – Market size and forecast 2022-2027 ($ million)
- Exhibit 53: Data Table on Water and air purification – Market size and forecast 2022-2027 ($ million)
- Exhibit 54: Chart on Water and air purification – Year-over-year growth 2022-2027 (%)
- Exhibit 55: Data Table on Water and air purification – Year-over-year growth 2022-2027 (%)
- 7.5 Tanning – Market size and forecast 2022-2027
- Exhibit 56: Chart on Tanning – Market size and forecast 2022-2027 ($ million)
- Exhibit 57: Data Table on Tanning – Market size and forecast 2022-2027 ($ million)
- Exhibit 58: Chart on Tanning – Year-over-year growth 2022-2027 (%)
- Exhibit 59: Data Table on Tanning – Year-over-year growth 2022-2027 (%)
- 7.6 Analytical instruments – Market size and forecast 2022-2027
- Exhibit 60: Chart on Analytical instruments – Market size and forecast 2022-2027 ($ million)
- Exhibit 61: Data Table on Analytical instruments – Market size and forecast 2022-2027 ($ million)
- Exhibit 62: Chart on Analytical instruments – Year-over-year growth 2022-2027 (%)
- Exhibit 63: Data Table on Analytical instruments – Year-over-year growth 2022-2027 (%)
- 7.7 Others – Market size and forecast 2022-2027
- Exhibit 64: Chart on Others – Market size and forecast 2022-2027 ($ million)
- Exhibit 65: Data Table on Others – Market size and forecast 2022-2027 ($ million)
- Exhibit 66: Chart on Others – Year-over-year growth 2022-2027 (%)
- Exhibit 67: Data Table on Others – Year-over-year growth 2022-2027 (%)
- 7.8 Market opportunity by Application
- Exhibit 68: Market opportunity by Application ($ million)
- Exhibit 69: Data Table on Market opportunity by Application ($ million)
8 Customer Landscape
- 8.1 Customer landscape overview
- Exhibit 70: Analysis of price sensitivity, lifecycle, customer purchase basket, adoption rates, and purchase criteria
9 Geographic Landscape
- 9.1 Geographic segmentation
- Exhibit 71: Chart on Market share by geography 2022-2027 (%)
- Exhibit 72: Data Table on Market share by geography 2022-2027 (%)
- 9.2 Geographic comparison
- Exhibit 73: Chart on Geographic comparison
- Exhibit 74: Data Table on Geographic comparison
- 9.3 APAC – Market size and forecast 2022-2027
- Exhibit 75: Chart on APAC – Market size and forecast 2022-2027 ($ million)
- Exhibit 76: Data Table on APAC – Market size and forecast 2022-2027 ($ million)
- Exhibit 77: Chart on APAC – Year-over-year growth 2022-2027 (%)
- Exhibit 78: Data Table on APAC – Year-over-year growth 2022-2027 (%)
- 9.4 Europe – Market size and forecast 2022-2027
- Exhibit 79: Chart on Europe – Market size and forecast 2022-2027 ($ million)
- Exhibit 80: Data Table on Europe – Market size and forecast 2022-2027 ($ million)
- Exhibit 81: Chart on Europe – Year-over-year growth 2022-2027 (%)
- Exhibit 82: Data Table on Europe – Year-over-year growth 2022-2027 (%)
- 9.5 North America – Market size and forecast 2022-2027
- Exhibit 83: Chart on North America – Market size and forecast 2022-2027 ($ million)
- Exhibit 84: Data Table on North America – Market size and forecast 2022-2027 ($ million)
- Exhibit 85: Chart on North America – Year-over-year growth 2022-2027 (%)
- Exhibit 86: Data Table on North America – Year-over-year growth 2022-2027 (%)
- 9.6 South America – Market size and forecast 2022-2027
- Exhibit 87: Chart on South America – Market size and forecast 2022-2027 ($ million)
- Exhibit 88: Data Table on South America – Market size and forecast 2022-2027 ($ million)
- Exhibit 89: Chart on South America – Year-over-year growth 2022-2027 (%)
- Exhibit 90: Data Table on South America – Year-over-year growth 2022-2027 (%)
- 9.7 Middle East and Africa – Market size and forecast 2022-2027
- Exhibit 91: Chart on Middle East and Africa – Market size and forecast 2022-2027 ($ million)
- Exhibit 92: Data Table on Middle East and Africa – Market size and forecast 2022-2027 ($ million)
- Exhibit 93: Chart on Middle East and Africa – Year-over-year growth 2022-2027 (%)
- Exhibit 94: Data Table on Middle East and Africa – Year-over-year growth 2022-2027 (%)
- 9.8 China – Market size and forecast 2022-2027
- Exhibit 95: Chart on China – Market size and forecast 2022-2027 ($ million)
- Exhibit 96: Data Table on China – Market size and forecast 2022-2027 ($ million)
- Exhibit 97: Chart on China – Year-over-year growth 2022-2027 (%)
- Exhibit 98: Data Table on China – Year-over-year growth 2022-2027 (%)
- 9.9 US – Market size and forecast 2022-2027
- Exhibit 99: Chart on US – Market size and forecast 2022-2027 ($ million)
- Exhibit 100: Data Table on US – Market size and forecast 2022-2027 ($ million)
- Exhibit 101: Chart on US – Year-over-year growth 2022-2027 (%)
- Exhibit 102: Data Table on US – Year-over-year growth 2022-2027 (%)
- 9.10 Germany – Market size and forecast 2022-2027
- Exhibit 103: Chart on Germany – Market size and forecast 2022-2027 ($ million)
- Exhibit 104: Data Table on Germany – Market size and forecast 2022-2027 ($ million)
- Exhibit 105: Chart on Germany – Year-over-year growth 2022-2027 (%)
- Exhibit 106: Data Table on Germany – Year-over-year growth 2022-2027 (%)
- 9.11 Japan – Market size and forecast 2022-2027
- Exhibit 107: Chart on Japan – Market size and forecast 2022-2027 ($ million)
- Exhibit 108: Data Table on Japan – Market size and forecast 2022-2027 ($ million)
- Exhibit 109: Chart on Japan – Year-over-year growth 2022-2027 (%)
- Exhibit 110: Data Table on Japan – Year-over-year growth 2022-2027 (%)
- 9.12 UK – Market size and forecast 2022-2027
- Exhibit 111: Chart on UK – Market size and forecast 2022-2027 ($ million)
- Exhibit 112: Data Table on UK – Market size and forecast 2022-2027 ($ million)
- Exhibit 113: Chart on UK – Year-over-year growth 2022-2027 (%)
- Exhibit 114: Data Table on UK – Year-over-year growth 2022-2027 (%)
- 9.13 Market opportunity by geography
- Exhibit 115: Market opportunity by geography ($ million)
- Exhibit 116: Data Tables on Market opportunity by geography ($ million)
10 Drivers, Challenges, and Trends
- 10.1 Market drivers
- 10.2 Market challenges
- 10.3 Impact of drivers and challenges
- Exhibit 117: Impact of drivers and challenges in 2022 and 2027
- 10.4 Market trends
11 Vendor Landscape
- 11.1 Overview
- 11.2 Vendor landscape
- Exhibit 118: Overview on Criticality of inputs and Factors of differentiation
- 11.3 Landscape disruption
- Exhibit 119: Overview on factors of disruption
- 11.4 Industry risks
- Exhibit 120: Impact of key risks on business
12 Vendor Analysis
- 12.1 Vendors covered
- Exhibit 121: Vendors covered
- 12.2 Market positioning of vendors
- Exhibit 122: Matrix on vendor position and classification
- 12.3 AlphaCure Ltd.
- Exhibit 123: AlphaCure Ltd. – Overview
- Exhibit 124: AlphaCure Ltd. – Product / Service
- Exhibit 125: AlphaCure Ltd. – Key offerings
- 12.4 Atlantic Ultraviolet Corp.
- Exhibit 126: Atlantic Ultraviolet Corp. – Overview
- Exhibit 127: Atlantic Ultraviolet Corp. – Product / Service
- Exhibit 128: Atlantic Ultraviolet Corp. – Key offerings
- 12.5 Broadcom Inc.
- Exhibit 129: Broadcom Inc. – Overview
- Exhibit 130: Broadcom Inc. – Business segments
- Exhibit 131: Broadcom Inc. – Key news
- Exhibit 132: Broadcom Inc. – Key offerings
- Exhibit 133: Broadcom Inc. – Segment focus
- 12.6 Danaher Corp.
- Exhibit 134: Danaher Corp. – Overview
- Exhibit 135: Danaher Corp. – Business segments
- Exhibit 136: Danaher Corp. – Key news
- Exhibit 137: Danaher Corp. – Key offerings
- Exhibit 138: Danaher Corp. – Segment focus
- 12.7 Dr. Honle AG
- Exhibit 139: Dr. Honle AG – Overview
- Exhibit 140: Dr. Honle AG – Business segments
- Exhibit 141: Dr. Honle AG – Key offerings
- Exhibit 142: Dr. Honle AG – Segment focus
- 12.8 Excelitas Technologies Corp.
- Exhibit 143: Excelitas Technologies Corp. – Overview
- Exhibit 144: Excelitas Technologies Corp. – Product / Service
- Exhibit 145: Excelitas Technologies Corp. – Key offerings
- 12.9 Heraeus Holding GmbH
- Exhibit 146: Heraeus Holding GmbH – Overview
- Exhibit 147: Heraeus Holding GmbH – Product / Service
- Exhibit 148: Heraeus Holding GmbH – Key offerings
- 12.10 IST Metz GmbH and Co. KG
- Exhibit 149: IST Metz GmbH and Co. KG – Overview
- Exhibit 150: IST Metz GmbH and Co. KG – Product / Service
- Exhibit 151: IST Metz GmbH and Co. KG – Key offerings
- 12.11 Luminus Inc.
- Exhibit 152: Luminus Inc. – Overview
- Exhibit 153: Luminus Inc. – Product / Service
- Exhibit 154: Luminus Inc. – Key offerings
- 12.12 OSRAM Licht AG
- Exhibit 155: OSRAM Licht AG – Overview
- Exhibit 156: OSRAM Licht AG – Business segments
- Exhibit 157: OSRAM Licht AG – Key offerings
- Exhibit 158: OSRAM Licht AG – Segment focus
- 12.13 Panasonic Holdings Corp.
- Exhibit 159: Panasonic Holdings Corp. – Overview
- Exhibit 160: Panasonic Holdings Corp. – Product / Service
- Exhibit 161: Panasonic Holdings Corp. – Key news
- Exhibit 162: Panasonic Holdings Corp. – Key offerings
- 12.14 Seoul Semiconductor Co. Ltd.
- Exhibit 163: Seoul Semiconductor Co. Ltd. – Overview
- Exhibit 164: Seoul Semiconductor Co. Ltd. – Product / Service
- Exhibit 165: Seoul Semiconductor Co. Ltd. – Key offerings
- 12.15 Signify NV
- Exhibit 166: Signify NV – Overview
- Exhibit 167: Signify NV – Business segments
- Exhibit 168: Signify NV – Key news
- Exhibit 169: Signify NV – Key offerings
- Exhibit 170: Signify NV – Segment focus
- 12.16 Ushio America Inc.
- Exhibit 171: Ushio America Inc. – Overview
- Exhibit 172: Ushio America Inc. – Product / Service
- Exhibit 173: Ushio America Inc. – Key offerings
- 12.17 Xylem Inc.
- Exhibit 174: Xylem Inc. – Overview
- Exhibit 175: Xylem Inc. – Business segments
- Exhibit 176: Xylem Inc. – Key offerings
- Exhibit 177: Xylem Inc. – Segment focus
13 Appendix
- 13.1 Scope of the report
- 13.2 Inclusions and exclusions checklist
- Exhibit 178: Inclusions checklist
- Exhibit 179: Exclusions checklist
- 13.3 Currency conversion rates for US$
- Exhibit 180: Currency conversion rates for US$
- 13.4 Research methodology
- Exhibit 181: Research methodology
- Exhibit 182: Validation techniques employed for market sizing
- Exhibit 183: Information sources
- 13.5 List of abbreviations
- Exhibit 184: List of abbreviations
About Us
Technavio is a leading global technology research and advisory company. Their research and analysis focus on emerging market trends and provide actionable insights to help businesses identify market opportunities and develop effective strategies to optimize their market positions. With over 500 specialized analysts, Technavio’s report library consists of more than 17,000 reports and counting, covering 800 technologies, spanning 50 countries. Their client base consists of enterprises of all sizes, including more than 100 Fortune 500 companies. This growing client base relies on Technavio’s comprehensive coverage, extensive research, and actionable market insights to identify opportunities in existing and potential markets and assess their competitive positions within changing market scenarios.
Contact
Technavio Research
Jesse Maida
Media & Marketing Executive
US: +1 844 364 1100
UK: +44 203 893 3200
Email: media@technavio.com
Website: www.technavio.com
![]()
![]() View original content to download multimedia:https://www.prnewswire.com/news-releases/uv-lamp-market-to-grow-at-a-cagr-of-20-41-from-2022-to-202-alphacure-ltd-atlantic-ultraviolet-corp-broadcom-inc-and-more-to-emerge-as-key-players—technavio-301877677.html
View original content to download multimedia:https://www.prnewswire.com/news-releases/uv-lamp-market-to-grow-at-a-cagr-of-20-41-from-2022-to-202-alphacure-ltd-atlantic-ultraviolet-corp-broadcom-inc-and-more-to-emerge-as-key-players—technavio-301877677.html
SOURCE Technavio
