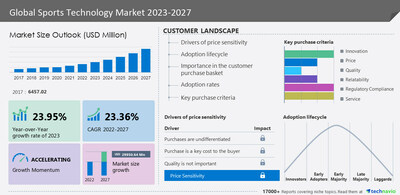
NEW YORK, Aug. 4, 2023 /PRNewswire/ — The sports technology market is set to grow by USD 29,950.64 million from 2022 to 2027. The market will be accelerating at a CAGR of 23.36% during the forecast period. The report offers an up-to-date analysis regarding the current global market scenario, the latest trends and drivers, and the overall market environment. The rising number of sports technology events is a prime factor driving the global sports technology market growth. Events using sports technology are not limited to online audiences. The use of sports technology in physical locations augments the target audience, actively encourages the concept of sports technology in the field, and improves the morale of sports technology players. For instance, the US has sports technology arenas in seven different locations, while Meltdown sports technology bars are present at 27 global locations, and Wangyu Cybernet Cafes are present at around 1,000 locations worldwide. These cities are introducing policies and signing partnership deals or agreements to encourage sports technology events. Hence, these factors will fuel the growth of the market focus during the forecast period. –Here is an Exclusive report talking about Market scenarios with a historical period (2017-2021) and the forecast period (2023-2027). Download Sample Report in minutes!

The sports technology market covers the following areas:
The report on the sports technology market provides a holistic update, market size and forecast, trends, growth drivers, and challenges, as well as vendor analysis.
Sports Technology Market 2023-2027 – Market Dynamics
The advent of visual technologies for sports is an emerging trend in the global sports technology market growth. Visual technologies such as VR and AI are gaining significance in general sports viewing and sports illustration. Furthermore, sports leagues, clubs, and coaches are increasingly using VR to deliver real-time experiences to aspiring players. However, VR allows athletes to train in real-world conditions using data collected during virtual training sessions. Also, VR allows athletes to have a better vision of the game, increase endurance, and predict the actions of opponents, thus, allowing them to enhance their techniques. Such developments are anticipated to continue, which will drive the growth of the market focus during the forecast period.
System integration and interoperability issues are major challenges hindering the growth of the global sports technology market growth. Generally, the adoption of advanced technology has increased significantly in many industries, including the sports industry, creating challenges for system integration and interoperability. Vendors must provide IT solutions that integrate seamlessly with the end-of-the-sports industry’s user’s IT infrastructure. Technical glitches during operations can incur costs to clubs and leagues and reduce operational efficiencies. However, the integration of multiple IT systems on traditional IT infrastructure can create a lot of cross-platform system integration issues, which may impede the growth of the market in focus during the forecast period.
What’s New?
- Special coverage on the Russia–Ukraine war; global inflation; recovery analysis from COVID-19; supply chain disruptions, global trade tensions; and risk of recession
- Global competitiveness and key competitor positions
- Market presence across multiple geographical footprints – Strong/Active/Niche/Trivial – Buy the report!
Sports Technology Market 2023-2027: Market Segmentation
Technavio has segmented the market based on End-user (sports associations, clubs, and leagues), Technology (Artificial intelligence or machine learning, Internet of things, and Augmented reality or virtual reality), and Geography (Europe, North America, APAC, South America, and Middle East and Africa).
- The sports associations segment will be significant for market growth during the forecast period. To run their operations smoothly, sports association uses sports technology solutions such as sports plus. The primary uses of sports technology in a sports association are publishing program information to member clubs and individuals, selecting event venues, generating registration forms, and overviewing member activities. Sports associations also use sports technology for sports analytics and for publishing player ranking based on the analytics data available. Additionally, they use sports technology in promoting events and updating audiences and member clubs with the latest news. Hence, multiple benefits of sports technology will boost its demand from sports associations which, in turn, will fuel the growth of the market in focus during the forecast period.
This report presents a detailed picture of the market by way of study, synthesis, and summation of data from multiple sources through an analysis of key parameters- View Sample Report
Companies Mentioned
- Athlete Intelligence
- Catapult Group International Ltd.
- Chetu Inc.
- Cisco Systems Inc.
- Epicor Software Corp.
- Firstbeat Technologies Oy
- International Business Machines Corp.
- Jonas Club Software
- SAP SE
- Kinexon GmbH
- Orreco
- PlaySight Interactive Ltd.
- Samsung Electronics Co. Ltd.
- Tableau Software LLC
- Active Network LLC
- Agile Sports Technologies Inc.
- Garmin Ltd
- SPay Inc.
- Sportradar AG
- Upper Hand Inc.
Vendor Offerings
- Catapult Group International Ltd. – The company offers sports technology solutions such as Hudl App.
- Chetu Inc. – The company offers sports technology solutions such as Vector Mouthguard.
- Cisco Systems Inc. – The company offers sports technology solutions such as Catapult One.
Gain instant access to 17,000+ market research reports.
Technavio’s SUBSCRIPTION platform
Related Reports:
The sports turf market size is estimated to grow at a CAGR of 11.98% between 2022 and 2027. The market size is forecasted to increase by USD 3,284.74 million. This report extensively covers market segmentation by type (private sports facilities, schools/colleges and universities, and professional world-class stadiums), product (PP sports turf, PE sports turf, and nylon sports turf), and geography (Europe, North America, APAC, South America, and Middle East and Africa). The increasing demand for outdoor sports is notably driving market growth.
The artificial intelligence market size in sports is expected to increase by USD 5.45 billion from 2021 to 2026, and the market’s growth momentum will accelerate at a CAGR of 30.8%. This report extensively covers the artificial intelligence market in sports segmentation by type (football, cricket, tennis, basketball, and others) and geography (North America, Europe, APAC, South America, and the Middle East and Africa). The increasing demand for data integration and visual analytics is one of the factors driving the artificial intelligence (AI) market growth in sports.
|
Sports Technology Market Scope |
|
|
Report Coverage |
Details |
|
Base year |
2022 |
|
Historic period |
2017-2021 |
|
Forecast period |
2023-2027 |
|
Growth momentum & CAGR |
Accelerate at a CAGR of 23.36% |
|
Market growth 2023-2027 |
USD 29,950.64 million |
|
Market structure |
Fragmented |
|
YoY growth 2022-2023(%) |
23.95 |
|
Regional analysis |
Europe, North America, APAC, South America, and Middle East and Africa |
|
Performing market contribution |
Europe at 36% |
|
Key countries |
US, China, Germany, France, and Italy |
|
Competitive landscape |
Leading Vendors, Market Positioning of Vendors, Competitive Strategies, and Industry Risks |
|
Key companies profiled |
Athlete Intelligence, Catapult Group International Ltd., Chetu Inc., Cisco Systems Inc., Epicor Software Corp., Firstbeat Technologies Oy, International Business Machines Corp., Jonas Club Software, SAP SE, Kinexon GmbH, Orreco, PlaySight Interactive Ltd., Samsung Electronics Co. Ltd., Tableau Software LLC, Active Network LLC, Agile Sports Technologies Inc., Garmin Ltd, SPay Inc., Sportradar AG, and Upper Hand Inc. |
|
Market dynamics |
Parent market analysis, Market growth inducers and obstacles, Fast-growing and slow-growing segment analysis, COVID 19 impact and recovery analysis and future consumer dynamics, Market condition analysis for forecast period |
|
Customization purview |
If our report has not included the data that you are looking for, you can reach out to our analysts and get segments customized. |
Key Topics Covered:
1 Executive Summary
- 1.1 Market overview
- Exhibit 01: Executive Summary – Chart on Market Overview
- Exhibit 02: Executive Summary – Data Table on Market Overview
- Exhibit 03: Executive Summary – Chart on Global Market Characteristics
- Exhibit 04: Executive Summary – Chart on Market by Geography
- Exhibit 05: Executive Summary – Chart on Market Segmentation by End-user
- Exhibit 06: Executive Summary – Chart on Market Segmentation by Technology
- Exhibit 07: Executive Summary – Chart on Incremental Growth
- Exhibit 08: Executive Summary – Data Table on Incremental Growth
- Exhibit 09: Executive Summary – Chart on Vendor Market Positioning
2 Market Landscape
- 2.1 Market ecosystem
- Exhibit 10: Parent market
- Exhibit 11: Market Characteristics
3 Market Sizing
- 3.1 Market definition
- Exhibit 12: Offerings of vendors included in the market definition
- 3.2 Market segment analysis
- Exhibit 13: Market segments
- 3.3 Market size 2022
- 3.4 Market outlook: Forecast for 2022-2027
- Exhibit 14: Chart on Global – Market size and forecast 2022-2027 ($ million)
- Exhibit 15: Data Table on Global – Market size and forecast 2022-2027 ($ million)
- Exhibit 16: Chart on Global Market: Year-over-year growth 2022-2027 (%)
- Exhibit 17: Data Table on Global Market: Year-over-year growth 2022-2027 (%)
4 Historic Market Size
- 4.1 Global sports technology market 2017 – 2021
- Exhibit 18: Historic Market Size – Data Table on Global sports technology market 2017 – 2021 ($ million)
- 4.2 End user Segment Analysis 2017 – 2021
- Exhibit 19: Historic Market Size – End user Segment 2017 – 2021 ($ million)
- 4.3 Technology Segment Analysis 2017 – 2021
- Exhibit 20: Historic Market Size – Technology Segment 2017 – 2021 ($ million)
- 4.4 Geography Segment Analysis 2017 – 2021
- Exhibit 21: Historic Market Size – Geography Segment 2017 – 2021 ($ million)
- 4.5 Country Segment Analysis 2017 – 2021
- Exhibit 22: Historic Market Size – Country Segment 2017 – 2021 ($ million)
5 Five Forces Analysis
- 5.1 Five forces summary
- Exhibit 23: Five forces analysis – Comparison between 2022 and 2027
- 5.2 Bargaining power of buyers
- Exhibit 24: Chart on Bargaining power of buyers – Impact of key factors 2022 and 2027
- 5.3 Bargaining power of suppliers
- Exhibit 25: Bargaining power of suppliers – Impact of key factors in 2022 and 2027
- 5.4 Threat of new entrants
- Exhibit 26: Threat of new entrants – Impact of key factors in 2022 and 2027
- 5.5 Threat of substitutes
- Exhibit 27: Threat of substitutes – Impact of key factors in 2022 and 2027
- 5.6 Threat of rivalry
- Exhibit 28: Threat of rivalry – Impact of key factors in 2022 and 2027
- 5.7 Market condition
- Exhibit 29: Chart on Market condition – Five forces 2022 and 2027
6 Market Segmentation by End-user
- 6.1 Market segments
- Exhibit 30: Chart on End-user – Market share 2022-2027 (%)
- Exhibit 31: Data Table on End-user – Market share 2022-2027 (%)
- 6.2 Comparison by End-user
- Exhibit 32: Chart on Comparison by End-user
- Exhibit 33: Data Table on Comparison by End-user
- 6.3 Sports association – Market size and forecast 2022-2027
- Exhibit 34: Chart on Sports association – Market size and forecast 2022-2027 ($ million)
- Exhibit 35: Data Table on Sports association – Market size and forecast 2022-2027 ($ million)
- Exhibit 36: Chart on Sports association – Year-over-year growth 2022-2027 (%)
- Exhibit 37: Data Table on Sports association – Year-over-year growth 2022-2027 (%)
- 6.4 Clubs and leagues – Market size and forecast 2022-2027
- Exhibit 38: Chart on Clubs and leagues – Market size and forecast 2022-2027 ($ million)
- Exhibit 39: Data Table on Clubs and leagues – Market size and forecast 2022-2027 ($ million)
- Exhibit 40: Chart on Clubs and leagues – Year-over-year growth 2022-2027 (%)
- Exhibit 41: Data Table on Clubs and leagues – Year-over-year growth 2022-2027 (%)
- 6.5 Market opportunity by End-user
- Exhibit 42: Market opportunity by End-user ($ million)
7 Market Segmentation by Technology
- 7.1 Market segments
- Exhibit 43: Chart on Technology – Market share 2022-2027 (%)
- Exhibit 44: Data Table on Technology – Market share 2022-2027 (%)
- 7.2 Comparison by Technology
- Exhibit 45: Chart on Comparison by Technology
- Exhibit 46: Data Table on Comparison by Technology
- 7.3 Artificial intelligence or machine learning – Market size and forecast 2022-2027
- Exhibit 47: Chart on Artificial intelligence or machine learning – Market size and forecast 2022-2027 ($ million)
- Exhibit 48: Data Table on Artificial intelligence or machine learning – Market size and forecast 2022-2027 ($ million)
- Exhibit 49: Chart on Artificial intelligence or machine learning – Year-over-year growth 2022-2027 (%)
- Exhibit 50: Data Table on Artificial intelligence or machine learning – Year-over-year growth 2022-2027 (%)
- 7.4 Internet of things – Market size and forecast 2022-2027
- Exhibit 51: Chart on Internet of things – Market size and forecast 2022-2027 ($ million)
- Exhibit 52: Data Table on Internet of things – Market size and forecast 2022-2027 ($ million)
- Exhibit 53: Chart on Internet of things – Year-over-year growth 2022-2027 (%)
- Exhibit 54: Data Table on Internet of things – Year-over-year growth 2022-2027 (%)
- 7.5 Augmented reality or virtual reality – Market size and forecast 2022-2027
- Exhibit 55: Chart on Augmented reality or virtual reality – Market size and forecast 2022-2027 ($ million)
- Exhibit 56: Data Table on Augmented reality or virtual reality – Market size and forecast 2022-2027 ($ million)
- Exhibit 57: Chart on Augmented reality or virtual reality – Year-over-year growth 2022-2027 (%)
- Exhibit 58: Data Table on Augmented reality or virtual reality – Year-over-year growth 2022-2027 (%)
- 7.6 Market opportunity by Technology
- Exhibit 59: Market opportunity by Technology ($ million)
8 Customer Landscape
- 8.1 Customer landscape overview
- Exhibit 60: Analysis of price sensitivity, lifecycle, customer purchase basket, adoption rates, and purchase criteria
9 Geographic Landscape
- 9.1 Geographic segmentation
- Exhibit 61: Chart on Market share by geography 2022-2027 (%)
- Exhibit 62: Data Table on Market share by geography 2022-2027 (%)
- 9.2 Geographic comparison
- Exhibit 63: Chart on Geographic comparison
- Exhibit 64: Data Table on Geographic comparison
- 9.3 Europe – Market size and forecast 2022-2027
- Exhibit 65: Chart on Europe – Market size and forecast 2022-2027 ($ million)
- Exhibit 66: Data Table on Europe – Market size and forecast 2022-2027 ($ million)
- Exhibit 67: Chart on Europe – Year-over-year growth 2022-2027 (%)
- Exhibit 68: Data Table on Europe – Year-over-year growth 2022-2027 (%)
- 9.4 North America – Market size and forecast 2022-2027
- Exhibit 69: Chart on North America – Market size and forecast 2022-2027 ($ million)
- Exhibit 70: Data Table on North America – Market size and forecast 2022-2027 ($ million)
- Exhibit 71: Chart on North America – Year-over-year growth 2022-2027 (%)
- Exhibit 72: Data Table on North America – Year-over-year growth 2022-2027 (%)
- 9.5 APAC – Market size and forecast 2022-2027
- Exhibit 73: Chart on APAC – Market size and forecast 2022-2027 ($ million)
- Exhibit 74: Data Table on APAC – Market size and forecast 2022-2027 ($ million)
- Exhibit 75: Chart on APAC – Year-over-year growth 2022-2027 (%)
- Exhibit 76: Data Table on APAC – Year-over-year growth 2022-2027 (%)
- 9.6 South America – Market size and forecast 2022-2027
- Exhibit 77: Chart on South America – Market size and forecast 2022-2027 ($ million)
- Exhibit 78: Data Table on South America – Market size and forecast 2022-2027 ($ million)
- Exhibit 79: Chart on South America – Year-over-year growth 2022-2027 (%)
- Exhibit 80: Data Table on South America – Year-over-year growth 2022-2027 (%)
- 9.7 Middle East and Africa – Market size and forecast 2022-2027
- Exhibit 81: Chart on Middle East and Africa – Market size and forecast 2022-2027 ($ million)
- Exhibit 82: Data Table on Middle East and Africa – Market size and forecast 2022-2027 ($ million)
- Exhibit 83: Chart on Middle East and Africa – Year-over-year growth 2022-2027 (%)
- Exhibit 84: Data Table on Middle East and Africa – Year-over-year growth 2022-2027 (%)
- 9.8 US – Market size and forecast 2022-2027
- Exhibit 85: Chart on US – Market size and forecast 2022-2027 ($ million)
- Exhibit 86: Data Table on US – Market size and forecast 2022-2027 ($ million)
- Exhibit 87: Chart on US – Year-over-year growth 2022-2027 (%)
- Exhibit 88: Data Table on US – Year-over-year growth 2022-2027 (%)
- 9.9 China – Market size and forecast 2022-2027
- Exhibit 89: Chart on China – Market size and forecast 2022-2027 ($ million)
- Exhibit 90: Data Table on China – Market size and forecast 2022-2027 ($ million)
- Exhibit 91: Chart on China – Year-over-year growth 2022-2027 (%)
- Exhibit 92: Data Table on China – Year-over-year growth 2022-2027 (%)
- 9.10 Germany – Market size and forecast 2022-2027
- Exhibit 93: Chart on Germany – Market size and forecast 2022-2027 ($ million)
- Exhibit 94: Data Table on Germany – Market size and forecast 2022-2027 ($ million)
- Exhibit 95: Chart on Germany – Year-over-year growth 2022-2027 (%)
- Exhibit 96: Data Table on Germany – Year-over-year growth 2022-2027 (%)
- 9.11 France – Market size and forecast 2022-2027
- Exhibit 97: Chart on France – Market size and forecast 2022-2027 ($ million)
- Exhibit 98: Data Table on France – Market size and forecast 2022-2027 ($ million)
- Exhibit 99: Chart on France – Year-over-year growth 2022-2027 (%)
- Exhibit 100: Data Table on France – Year-over-year growth 2022-2027 (%)
- 9.12 Italy – Market size and forecast 2022-2027
- Exhibit 101: Chart on Italy – Market size and forecast 2022-2027 ($ million)
- Exhibit 102: Data Table on Italy – Market size and forecast 2022-2027 ($ million)
- Exhibit 103: Chart on Italy – Year-over-year growth 2022-2027 (%)
- Exhibit 104: Data Table on Italy – Year-over-year growth 2022-2027 (%)
- 9.13 Market opportunity by geography
- Exhibit 105: Market opportunity by geography ($ million)
10 Drivers, Challenges, and Trends
- 10.1 Market drivers
- 10.2 Market challenges
- 10.3 Impact of drivers and challenges
- Exhibit 106: Impact of drivers and challenges in 2022 and 2027
- 10.4 Market trends
11 Vendor Landscape
- 11.1 Overview
- 11.2 Vendor landscape
- Exhibit 107: Overview on Criticality of inputs and Factors of differentiation
- 11.3 Landscape disruption
- Exhibit 108: Overview on factors of disruption
- 11.4 Industry risks
- Exhibit 109: Impact of key risks on business
12 Vendor Analysis
- 12.1 Vendors covered
- Exhibit 110: Vendors covered
- 12.2 Market positioning of vendors
- Exhibit 111: Matrix on vendor position and classification
- 12.3 Agile Sports Technologies Inc.
- Exhibit 112: Agile Sports Technologies Inc. – Overview
- Exhibit 113: Agile Sports Technologies Inc. – Product / Service
- Exhibit 114: Agile Sports Technologies Inc. – Key offerings
- 12.4 Athlete Intelligence
- Exhibit 115: Athlete Intelligence – Overview
- Exhibit 116: Athlete Intelligence – Product / Service
- Exhibit 117: Athlete Intelligence – Key offerings
- 12.5 Catapult Group International Ltd.
- Exhibit 118: Catapult Group International Ltd. – Overview
- Exhibit 119: Catapult Group International Ltd. – Business segments
- Exhibit 120: Catapult Group International Ltd. – Key offerings
- Exhibit 121: Catapult Group International Ltd. – Segment focus
- 12.6 Chetu Inc.
- Exhibit 122: Chetu Inc. – Overview
- Exhibit 123: Chetu Inc. – Product / Service
- Exhibit 124: Chetu Inc. – Key offerings
- 12.7 Cisco Systems Inc.
- Exhibit 125: Cisco Systems Inc. – Overview
- Exhibit 126: Cisco Systems Inc. – Business segments
- Exhibit 127: Cisco Systems Inc. – Key news
- Exhibit 128: Cisco Systems Inc. – Key offerings
- Exhibit 129: Cisco Systems Inc. – Segment focus
- 12.8 Epicor Software Corp.
- Exhibit 130: Epicor Software Corp. – Overview
- Exhibit 131: Epicor Software Corp. – Product / Service
- Exhibit 132: Epicor Software Corp. – Key offerings
- 12.9 Firstbeat Technologies Oy
- Exhibit 133: Firstbeat Technologies Oy – Overview
- Exhibit 134: Firstbeat Technologies Oy – Product / Service
- Exhibit 135: Firstbeat Technologies Oy – Key offerings
- 12.10 International Business Machines Corp.
- Exhibit 136: International Business Machines Corp. – Overview
- Exhibit 137: International Business Machines Corp. – Business segments
- Exhibit 138: International Business Machines Corp. – Key news
- Exhibit 139: International Business Machines Corp. – Key offerings
- Exhibit 140: International Business Machines Corp. – Segment focus
- 12.11 Jonas Club Software
- Exhibit 141: Jonas Club Software – Overview
- Exhibit 142: Jonas Club Software – Product / Service
- Exhibit 143: Jonas Club Software – Key offerings
- 12.12 PlaySight Interactive Ltd.
- Exhibit 144: PlaySight Interactive Ltd. – Overview
- Exhibit 145: PlaySight Interactive Ltd. – Product / Service
- Exhibit 146: PlaySight Interactive Ltd. – Key offerings
- 12.13 Samsung Electronics Co. Ltd.
- Exhibit 147: Samsung Electronics Co. Ltd. – Overview
- Exhibit 148: Samsung Electronics Co. Ltd. – Business segments
- Exhibit 149: Samsung Electronics Co. Ltd. – Key news
- Exhibit 150: Samsung Electronics Co. Ltd. – Key offerings
- Exhibit 151: Samsung Electronics Co. Ltd. – Segment focus
- 12.14 SAP SE
- Exhibit 152: SAP SE – Overview
- Exhibit 153: SAP SE – Business segments
- Exhibit 154: SAP SE – Key news
- Exhibit 155: SAP SE – Key offerings
- Exhibit 156: SAP SE – Segment focus
- 12.15 Sportradar AG
- Exhibit 157: Sportradar AG – Overview
- Exhibit 158: Sportradar AG – Business segments
- Exhibit 159: Sportradar AG – Key offerings
- Exhibit 160: Sportradar AG – Segment focus
- 12.16 Tableau Software LLC
- Exhibit 161: Tableau Software LLC – Overview
- Exhibit 162: Tableau Software LLC – Product / Service
- Exhibit 163: Tableau Software LLC – Key offerings
- 12.17 Upper Hand Inc.
- Exhibit 164: Upper Hand Inc. – Overview
- Exhibit 165: Upper Hand Inc. – Product / Service
- Exhibit 166: Upper Hand Inc. – Key offerings
13 Appendix
- 13.1 Scope of the report
- 13.2 Inclusions and exclusions checklist
- Exhibit 167: Inclusions checklist
- Exhibit 168: Exclusions checklist
- 13.3 Currency conversion rates for US$
- Exhibit 169: Currency conversion rates for US$
- 13.4 Research methodology
- Exhibit 170: Research methodology
- Exhibit 171: Validation techniques employed for market sizing
- Exhibit 172: Information sources
- 13.5 List of abbreviations
- Exhibit 173: List of abbreviations
About Us
Technavio is a leading global technology research and advisory company. Their research and analysis focuses on emerging market trends and provides actionable insights to help businesses identify market opportunities and develop effective strategies to optimize their market positions. With over 500 specialized analysts, Technavio’s report library consists of more than 17,000 reports and counting, covering 800 technologies, spanning across 50 countries. Their client base consists of enterprises of all sizes, including more than 100 Fortune 500 companies. This growing client base relies on Technavio’s comprehensive coverage, extensive research, and actionable market insights to identify opportunities in existing and potential markets and assess their competitive positions within changing market scenarios.
Contact
Technavio Research
Jesse Maida
Media & Marketing Executive
US: +1 844 364 1100
UK: +44 203 893 3200
Email: media@technavio.com
Website: www.technavio.com
![]()
![]() View original content to download multimedia:https://www.prnewswire.com/news-releases/the-sports-technology-market-size-to-grow-by-usd-29-950-64-million-from-2022-to-2027the-rising-number-of-sports-technology-events-drives-the-market-growth—technavio-301892868.html
View original content to download multimedia:https://www.prnewswire.com/news-releases/the-sports-technology-market-size-to-grow-by-usd-29-950-64-million-from-2022-to-2027the-rising-number-of-sports-technology-events-drives-the-market-growth—technavio-301892868.html
SOURCE Technavio
